
What is the ROI of the website?
At the heart of any CEO or marketing manager’s business goals is one primary metric: Return on Investment (ROI). If they can’t turn a profit, they can’t stay in business, so their marketing needs to show a positive ROI. However, it’s your job to guide executives to look at the right statistics for measuring ROI.
For example, your CEO may log into the main screen of Google Analytics, see that traffic has barely increased, and show concern. However, you want to point that CEO beyond just looking at traffic volume to look at leads and revenue gained from the website. You must help educate them on what metrics are important to determining ROI and then show them how to monitor the right stats.
As long as you have set up goal tracking on your site, a key report to show is the Goals Overview (Conversions > Goals > Overview). Instead of just showing quantities of sessions and users, look at how many people filled out forms on the site, made purchases, downloaded resources, or completed other goals relevant to the business. In addition, look at conversion rate to see what percent of users are completing goals.
When you are able to tie monetary amounts to goals on your site, the Goal Value metric can provide an actual dollar figure to estimate ROI from your site. Depending on the business model, you can approach this multiple ways. If you sell items directly through your site, you can attach a specific dollar amount to a goal. For example, for a goal that indicates an ebook purchase for $14.99, the goal value would be $14.99.
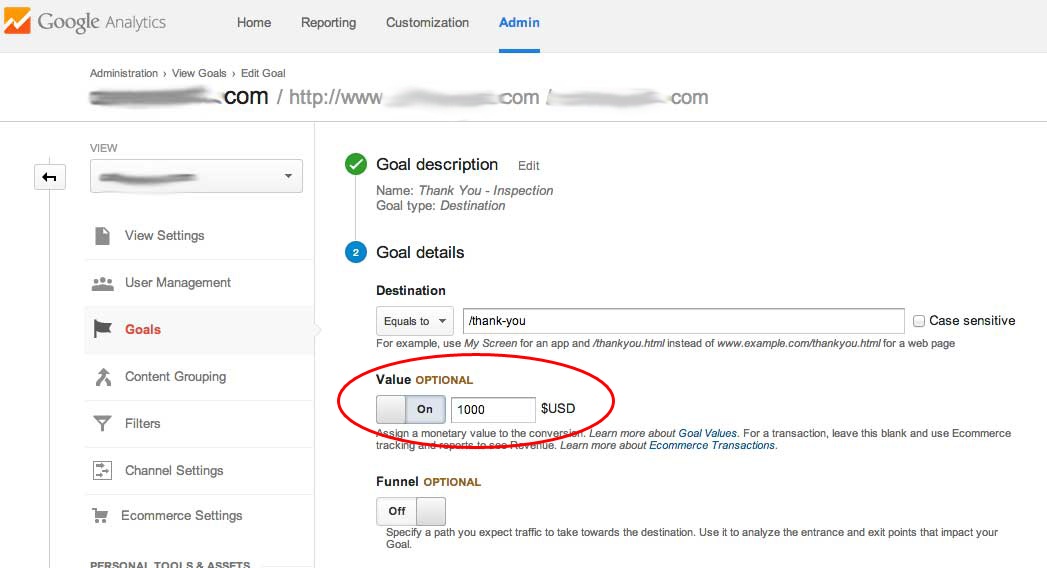
Perhaps you don’t sell items directly through your site but initiate leads via a contact form. In this case, you should review past records to estimate how much revenue you receive, on average, per lead. For example, if you find that you average $1,000 in sales for every person that contacts you via your site for a specific service, you can then use $1,000 as the goal value.
To set up goal values, either edit an existing goal or create a new goal (see more details on setting up goals in this article). Once you’re on the Goal Details screen, set the Value slider to On. You will then either enter an amount for a value or, if you’re using Event tracking, choose to use a value assigned to an Event.
As goals are tracked, you’ll then see the Goal Value amounts appear on the Goals Overview screen. To see the Goal Value for a specific goal, use the top dropdown to select a goal. You’ll then see completions, conversion rate and value for that goal.

Once you are able to estimate the sales that your website is generating, you can calculate the ROI by estimating the cost of maintaining the site (Marketing Costs), plus the cost of delivering your product or services (Cost of Goods Sold). Don’t forget to include the cost of AdWords or other advertising in the Marketing Costs if you are using paid channels to drive traffic.
The Cost of Goods Sold should include everything your business spends (other than what you have included in the Marketing Costs) to deliver the product or service. Your company accountant can help you pull together this number.
The formula you can use for calculating the ROI of your website is then calculated like this.
Profit = (Estimated Revenue from Website – Marketing Costs – Cost of Goods Sold)
ROI = Profit / Marketing Cost
We’ve discussed using Goals to track estimated revenue. Of course, if you are using Google Analytics Ecommerce tracking, you can get revenue directly from the Ecommerce reports. In fact, you may want to combine both approaches, using Ecommerce tracking to calculate the revenue from online sales and Goal tracking to estimate the revenue contribution that the website makes to sales that do not close directly on the site (e.g., phone orders).
One word of caution. It is important not to simply pull the ROI numbers that appear on Google Analytics reports and present them to your company without going through the analysis described here. The default ROI numbers coming from Google Analytics do not include all your costs, and can be misleading, as described in this post.
Who is visiting our website?
Pushing users to a site can be done easily enough through advertising and social sharing. However, a business owner wants to know that the right people are actually making it to their site. If your most valuable customers are women aged 35-44, you want to know a high percentage of your website traffic is made up of that demographic and that you’re not wasting dollars or resources bringing users who are unlikely to convert.
Google Analytics offers a number of reports to help indicate who is visiting your site and who are your most valuable users. Demographic and Interest reports prove helpful in providing general information about users.
First, note that setting up these reports involves modifying your tracking code, as well as settings in Google Analytics. Work with a developer if necessary to go through these steps.
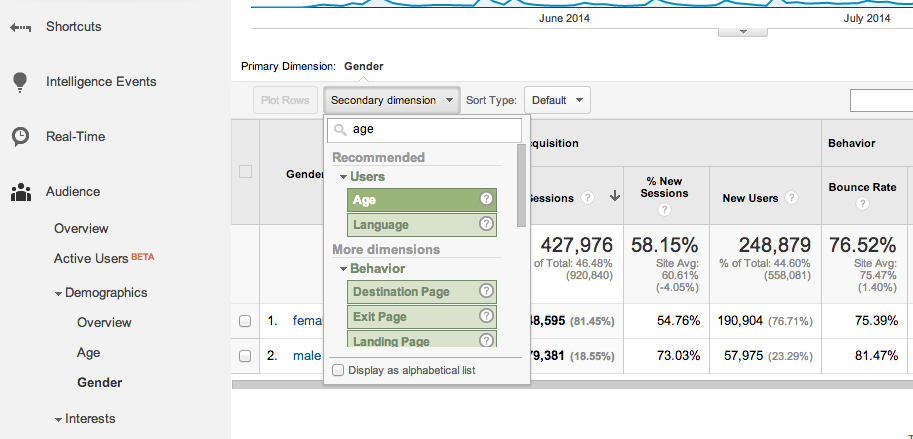
Once you’ve gone through setup, you can now view data in the Demographics and Interest reports found under the Audience category. In the case mentioned earlier, where we’d like to see how many visitors fall into the female 35-44 category, start by going to Demographics > Gender. Next, click the Secondary Dimension dropdown and type “age” to select that option.
In this case, you’ll then be able to see that females aged 35-44 make up close to 20% of sessions.
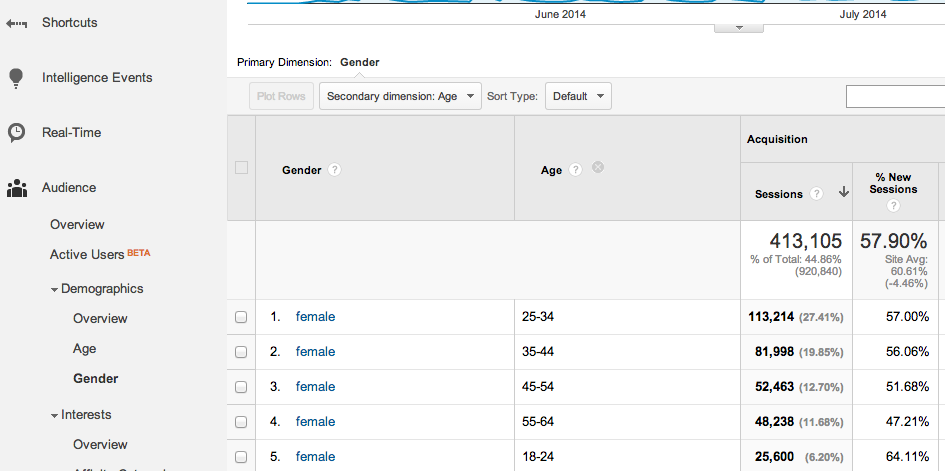
This report can guide you in two directions. First, you can get an approximate idea of how many of your visitors are actually in your target demographic. Second, you can see if a different demographic than you’re currently targeting proves to include valuable customers. You may even find your “target demographic” is different than you had previously assumed. In this example, we can see that more females in the 25-34 bracket visit than the 35-44 bracket. This data should spur content and ad targeting considerations to focus more heavily on converting those of the 25-34 bracket landing on your site.
How are people finding our website?
Often a boss or CEO asks this question wanting to know how specific online channels are performing. For example, he may be paying for social media management, a Google AdWords campaign, or SEO-related modifications to a site and desiring to know what kind of return he’s getting from each.
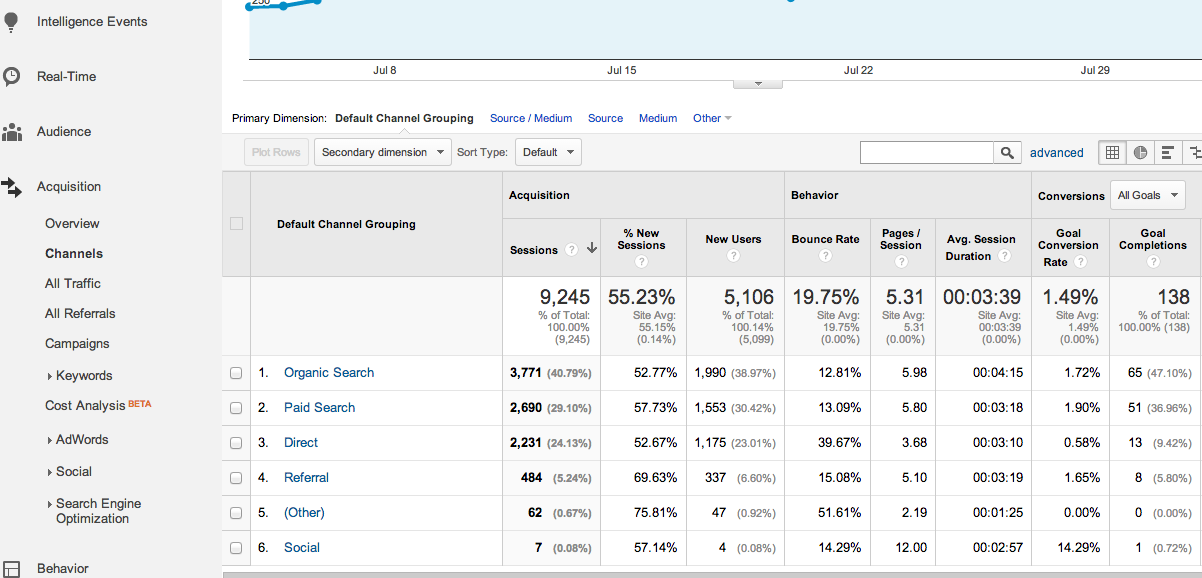
The Channels report (Acquisition > Channels) provides a high level overview of how people find your site, how engaged users from each channel are and how well each channel converts. By default, Channels include paid search, organic search, display advertising, referrals, social media, email and direct sessions. You can click any of these channels to look further at specific keywords, websites or campaigns. Review not only how many sessions and new users came from each channel but also how much time these users spent on the site and how likely they were to complete goals.
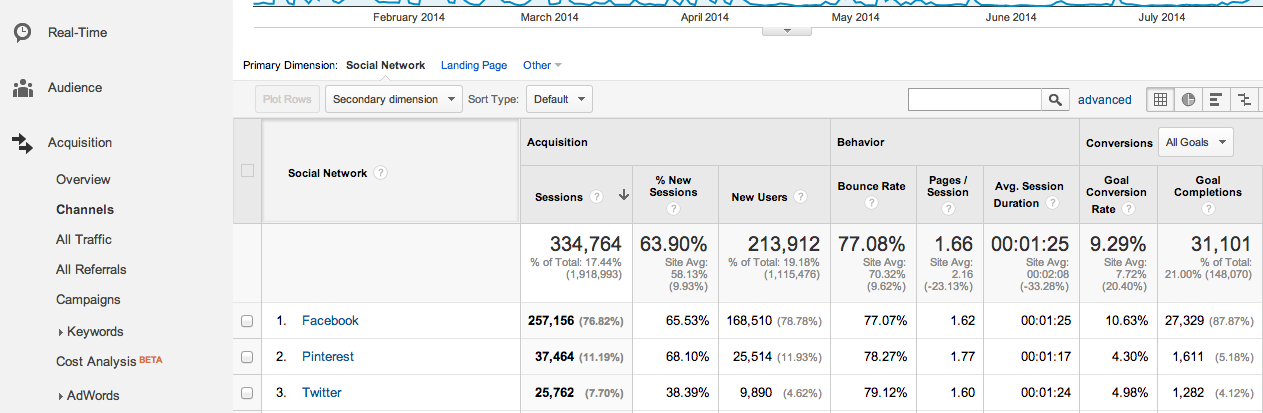
In this example, we’ve selected Social channels and are comparing Facebook, Twitter and Pinterest, which all drive a decent amount of traffic to the site. We can see that Facebook by far proves the most valuable, in volume of users as well as goal completions and conversion rate.
Bonus: Answer before asked
As you work with your client or your boss, learn how they think, what goals matter to them and how analytics data applies to their business. While you should always jump to point them to the right data when asked, ultimately, you can provide an even greater value to them by answering questions before they have to ask them. Using a reporting tool (we’re partial to Megalytic), can help you to build reports customized to the specific needs of your team or client to allow you to proactively discuss the website’s performance.
Conclusion
Starting with knowledge of Google Analytics and the reports available, you can translate this data to inform practical business decisions. Go beyond just looking at how many sessions you’re getting to analyze who your online audience is, how they’re getting to your site, and what channels provide the most value. Your boss or client will thank you for helping them see how analytics can guide their business goals.

