Viewing People Data in Facebook Insights
First, let’s look at the most detailed demographic data you can see, located in the People section. Make sure you log into Facebook with an account that has been granted a Page role and select Insights from the top bar of the page. Then, choose People from the left sidebar.
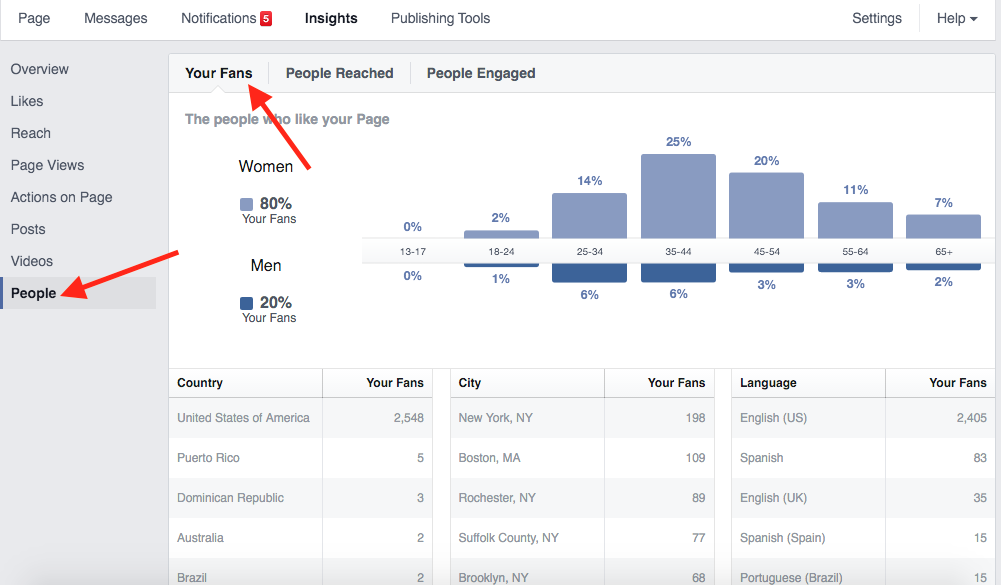
Fan Demographics
Within the first tab, you can see demographic data about Fans - the people who currently like your page. The graph at the top helps you identify the top categories of individuals. In this example, women 35-44 make up the largest category, followed by women 45-54. Based on this data, we can see that this page is successfully reaching its intended target of middle-aged women.
Below the graph, we can see the top geographic locations where Fans live. As a national-focused interest group, the Fans are primarily in the USA. You may have noticed that there is an unusually large international following. This may indicate the presence of fake profiles, though it could also indicate a need to refine targeting efforts.
Next, the Cities data reflects this group’s desire to primarily reach people in New York and Massachusetts. We can also distinguish the areas where the brand is generating the most interest. Besides the high-population areas around New York City, Long Island, and Boston, we can see that Rochester, NY ranks in the top five cities. This data indicates a base of interest in the western part of New York. That information becomes valuable if the organization is considering areas upstate in which to expand their targeting. They now know that there is a foundation of awareness in Rochester on which they can capitalize.
Finally, the Language column shows the default language chosen by your fans when setting up their Facebook accounts. While English dominates here, we can tell that there is enough interest from Spanish speakers to consider translating resources into Spanish in order to reach those individuals and more who may later become interested in the organization.
Reach Demographics
The next tab in this section, People Reached, shows anyone who was exposed to content from your brand page over the last 28 days. These individuals may be seeing posts for a number of reasons: either they are Fans who currently like the page, friends of people who liked or commented on a post, or are the target demographic for advertising.
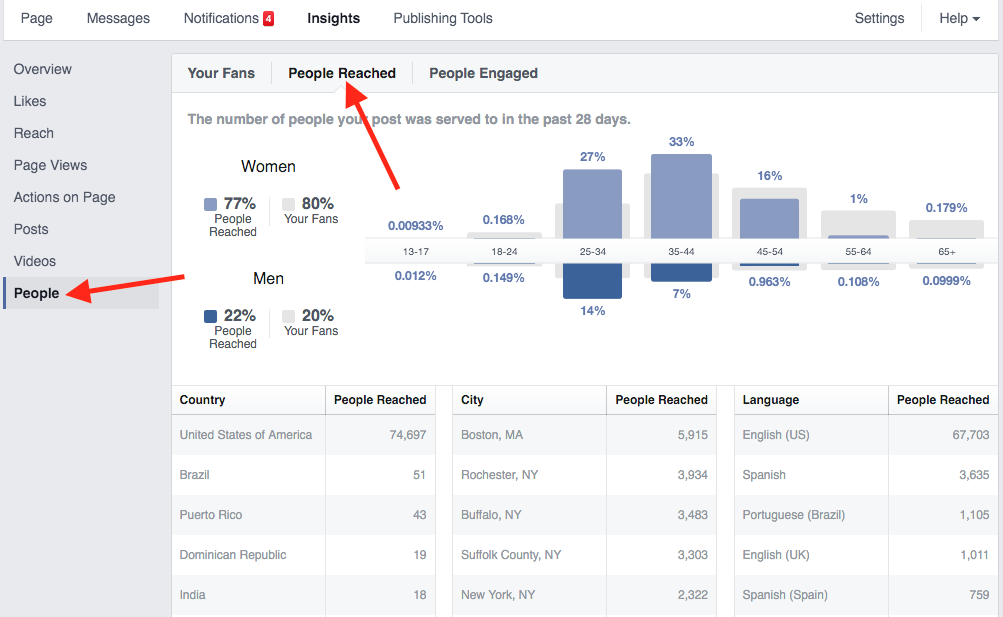
This section can potentially contain very different demographic data from what you see in the Your Fans section. Fans are not automatically shown your content due to Facebook limiting brand page reach. But a post can still go viral and receive likes and comments from people all over Facebook. In addition, promoted posts may target audience subsets that don’t reflect your fan base as a whole.
Based on this data, we can see that the top reached category lines up with the top for likes (female 35-44). However, we also notice that females 25-34 make up a much larger percentage of people reached than people who like the page, where females 45-54 made up a bigger proportion. In addition, men make up a slightly higher percentage of reach than likes. Overall, this data reflects that ad targeting, which makes up a significant amount of this page’s promotion, is successfully reaching women between the ages of 25 and 34.
Engagement Demographics
The final tab shows people engaged, measuring demographics for those who chose to interact with your page in some way over the past 28 days. These individuals may have liked, commented on or shared posts, or they may have interacted with your page in other ways, such as by viewing videos.
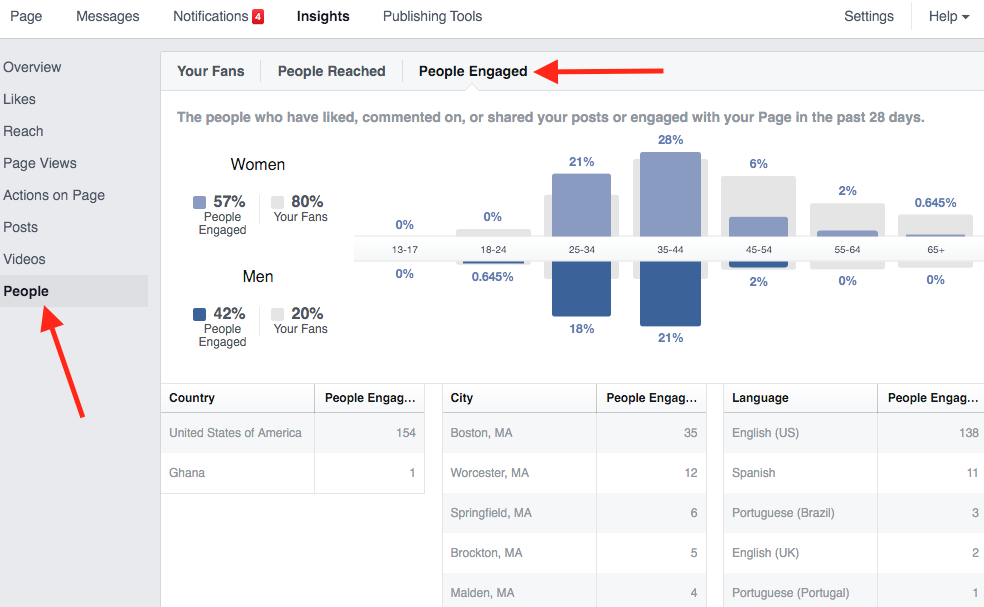
As you can see, the people who actually engage with your page can differ demographically from both those who like your page and those whom you’ve reached. This report offers telling information about those who are engaged enough to interact with the content that you post.
For instance, in this section, men make up a much higher percentage of people engaged than the previous two reports suggest. This data tells us that, while the group has defined its target as middle-aged women, men 25-44 who see the content are more likely to engage than expected. Based on this information, the group may want to test more ad spend and messaging geared toward targeting men in addition to women.
In addition, while New York represents the majority of likes and reach, Massachusetts contains a higher number of people who choose to engage with the page. You can see five cities within Massachusetts shown as locations from which people engaged. This also shows that some Spanish and Portuguese speakers engaged with the page, indicating more potential value for translating resources into other languages. Finally, we can see that while likes occurred from other countries, practically no engagement occurred from outside of the USA, which is to be expected as international engagement is not a goal.

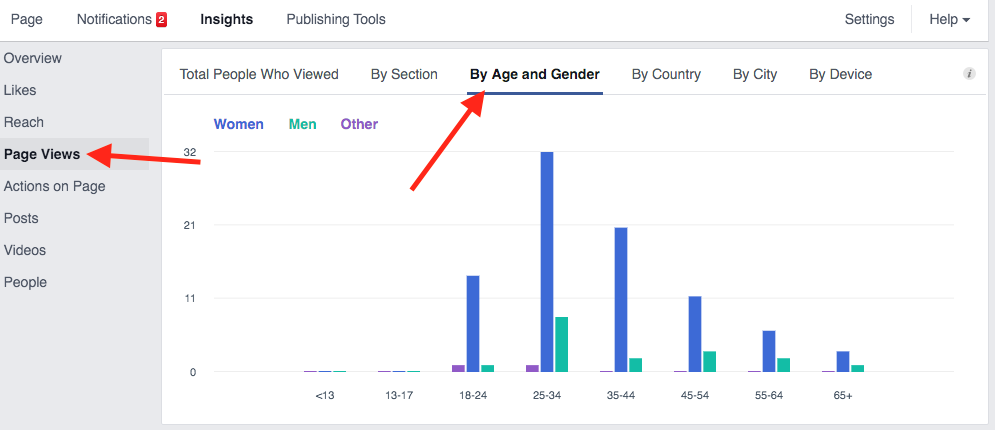
Pageview Demographics
Beyond the People section, you can find additional demographic information about people who encounter your page in other sections of Facebook Insights. The Pageviews section allows you to see totals for how many people looked at some section of your Facebook page, broken down by demographics. In this example, we show Age and Gender, but you can also look at Country or City to analyze geographic locations.

This example shows data from an organization providing services for individuals with disabilities. A recent goal has been to recruit employees and Facebook ads have been targeting individuals potentially looking for work. Here, we can see that those who have chosen to take a closer look at the page fall primarily into the female 25-34 category, indicating a possible target of interest when reaching out to prospective employees.
Similar to the way Facebook presents the Page Views data, the Actions on Page section also allows you to break out data by Age & Gender, City, or Country. In this section, you can analyze demographics of those who clicked to get directions, call from a mobile device, or visit your website.
Conclusion
You’ve taken the time to define your ideal target audience. You’ve worked to craft copy and creative that is intended to appeal to this market.
Now, put those ideas to the test by analyzing their impact on social media. Facebook Insights allows you to learn more about the demographics of those who are potentially interested in your brand based on their actions and your reach. As you’re often likely to have your first point of contact with people online, social media data can provide an invaluable window into the people who actually want to engage with you. It can also shed light on who your best potential customers may be. Invest in the time to look at your brand page’s Insights to determine who your online prospects are.
This data can either cement or alter your previous conceptions of your audience. It can tell you where your intended demographic may skew from your actual demographic, or if you are right on target. Use this information to drive your future ad targeting parameters and to help you better tailor messaging toward the demographics that truly care about your brand.

