
Dashboards or Reports?
First you’ll want to consider whether your agency wants to provide clients with dashboards or reports. See our post on Dashboards or Reports – Which Is Better to learn a bit about the benefits and drawbacks of each. To some extent, your choice will depend on the preferences of your clients. You’ll want to think about your clients, how they use data, and which approach would be best for them.
Most tools come with a specific strength: dashboards or client reporting (not both). Knowing which style is better for your agency and clients will help you select the right tool.
The Client Dashboard Model
Some agencies provide their clients with a dashboard (or dashboards) that they can log into on their own to find key metrics about website performance and campaigns. This approach is relatively low maintenance, which is why some agencies like it. Simply select the KPIs, set up the dashboard, and you are done. The clients do the rest, logging in to access their own data. It’s a pull model, rather than a push model – clients pull the data when they need it or want it.
A downside to using dashboards is that this approach requires your clients to be relatively engaged and curious. If a client is not engaged, they will not log in and look at the data.
The dashboard approach also requires your clients to be educated about data and to understand the KPIs that you have set up to track performance. If your clients are relatively sophisticated about web analytics and are able to interpret data, then this approach can work well.
However, there can be downsides to this direct access to data. Suppose, for example, that you are working with a client and you are transitioning from Campaign A to Campaign B. The client’s dashboard may have only been set up to track Campaign A. So, during the transition, this is what the client will see in their dashboard.
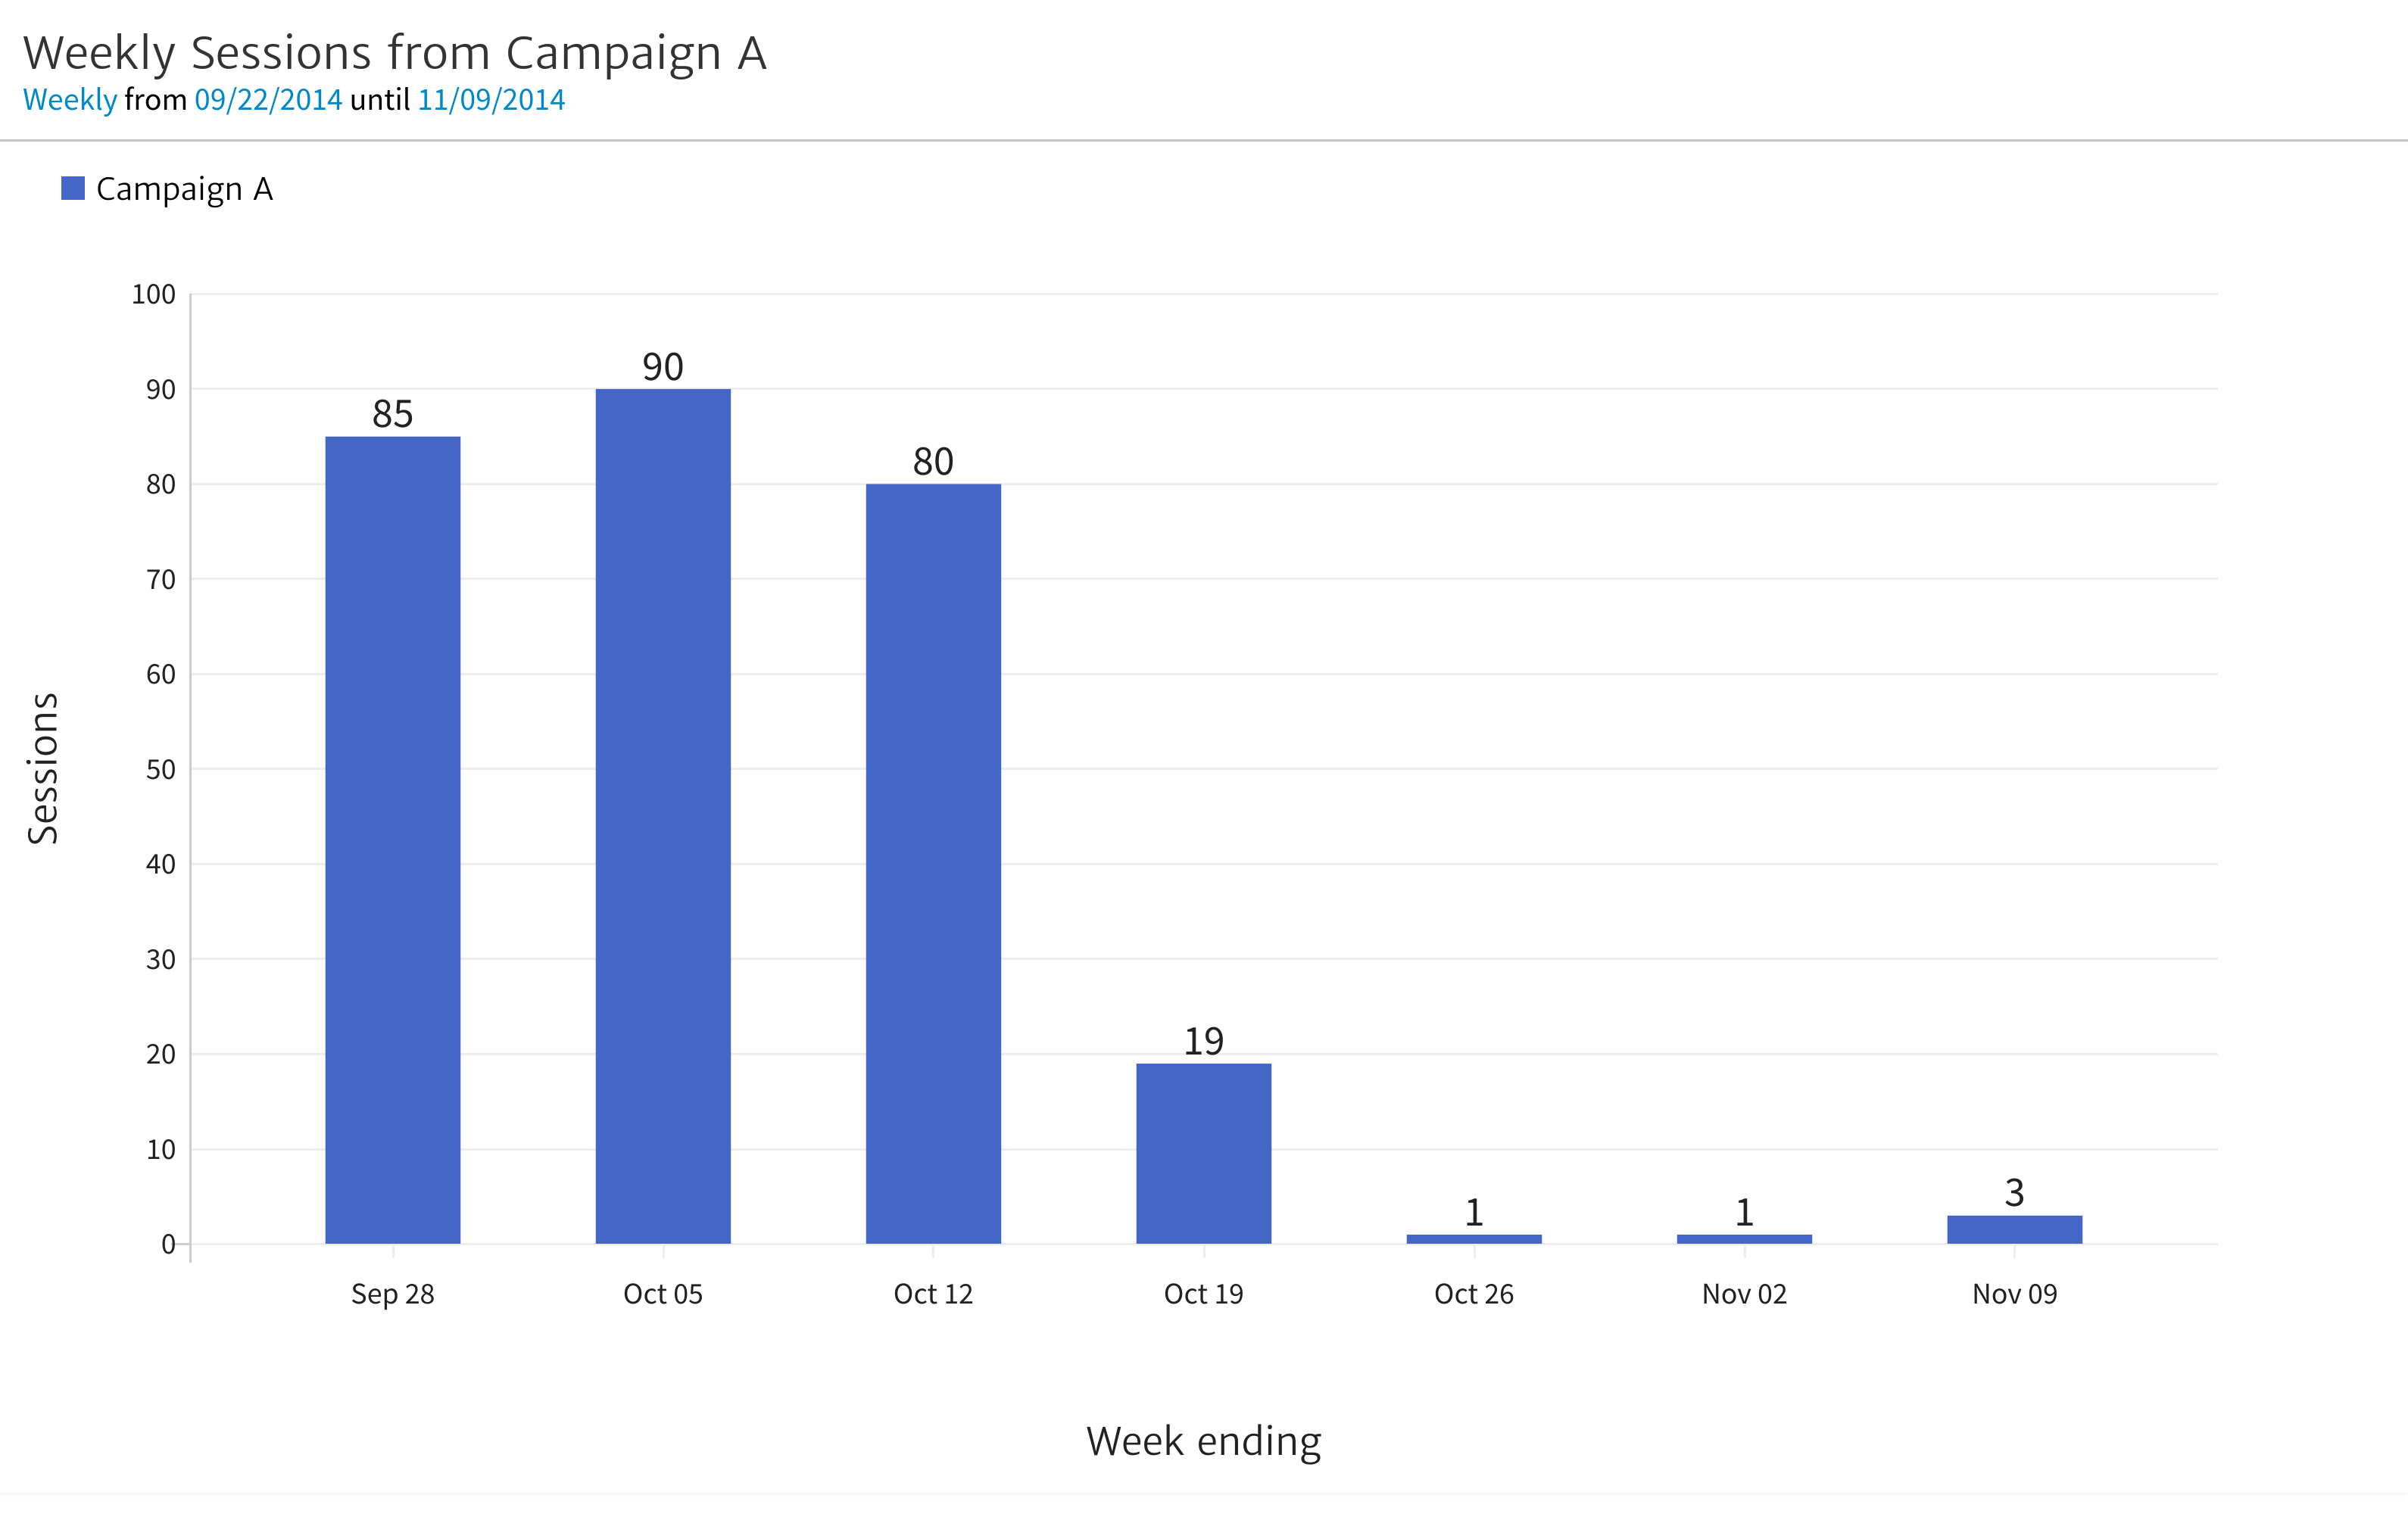
They’ll see a huge drop and become alarmed the campaign is no longer working.
The Client Reporting Model
In contrast to the dashboard model, some agencies choose to create monthly reports for their clients. The reports are usually emailed to each client as PDF attachments (or links to a web page). This is a push model, rather than a pull model, where the agency proactively sends the report to the client and may schedule a time to review the report with them.
This approach may be more appropriate if your clients are not web analytics gurus. Reports typically contain text summaries to explain the data appearing in charts and graphs. By including these summaries, it gives your agency an opportunity to describe the insights in the data and relate them back to activities that the agency is engaged in. It also provides your agency with an opportunity to highlight successes and to explain what is being done in areas that need improvement.
Client reporting requires more hands-on work, requiring your agency to update the client report each month and add text to explain the latest results. However, some agencies find that this extra work is worth it, because the monthly report becomes an important part of their agency-client communication where results are discussed each month and plans are made for what work needs to be done in the upcoming months.
In the client reporting model, somebody at the agency – perhaps an Account Manager or Digital Marketing Manager – is usually responsible for each client’s report. The charts and graphs in the report may not change much from month to month – except for getting refreshed with the latest data. However, the person responsible for the report will update the summary information; and may also update the charts when necessary. For example, in the case described above – where the agency is transitioning from Campaign A to Campaign B – they would update to chart to something like this.
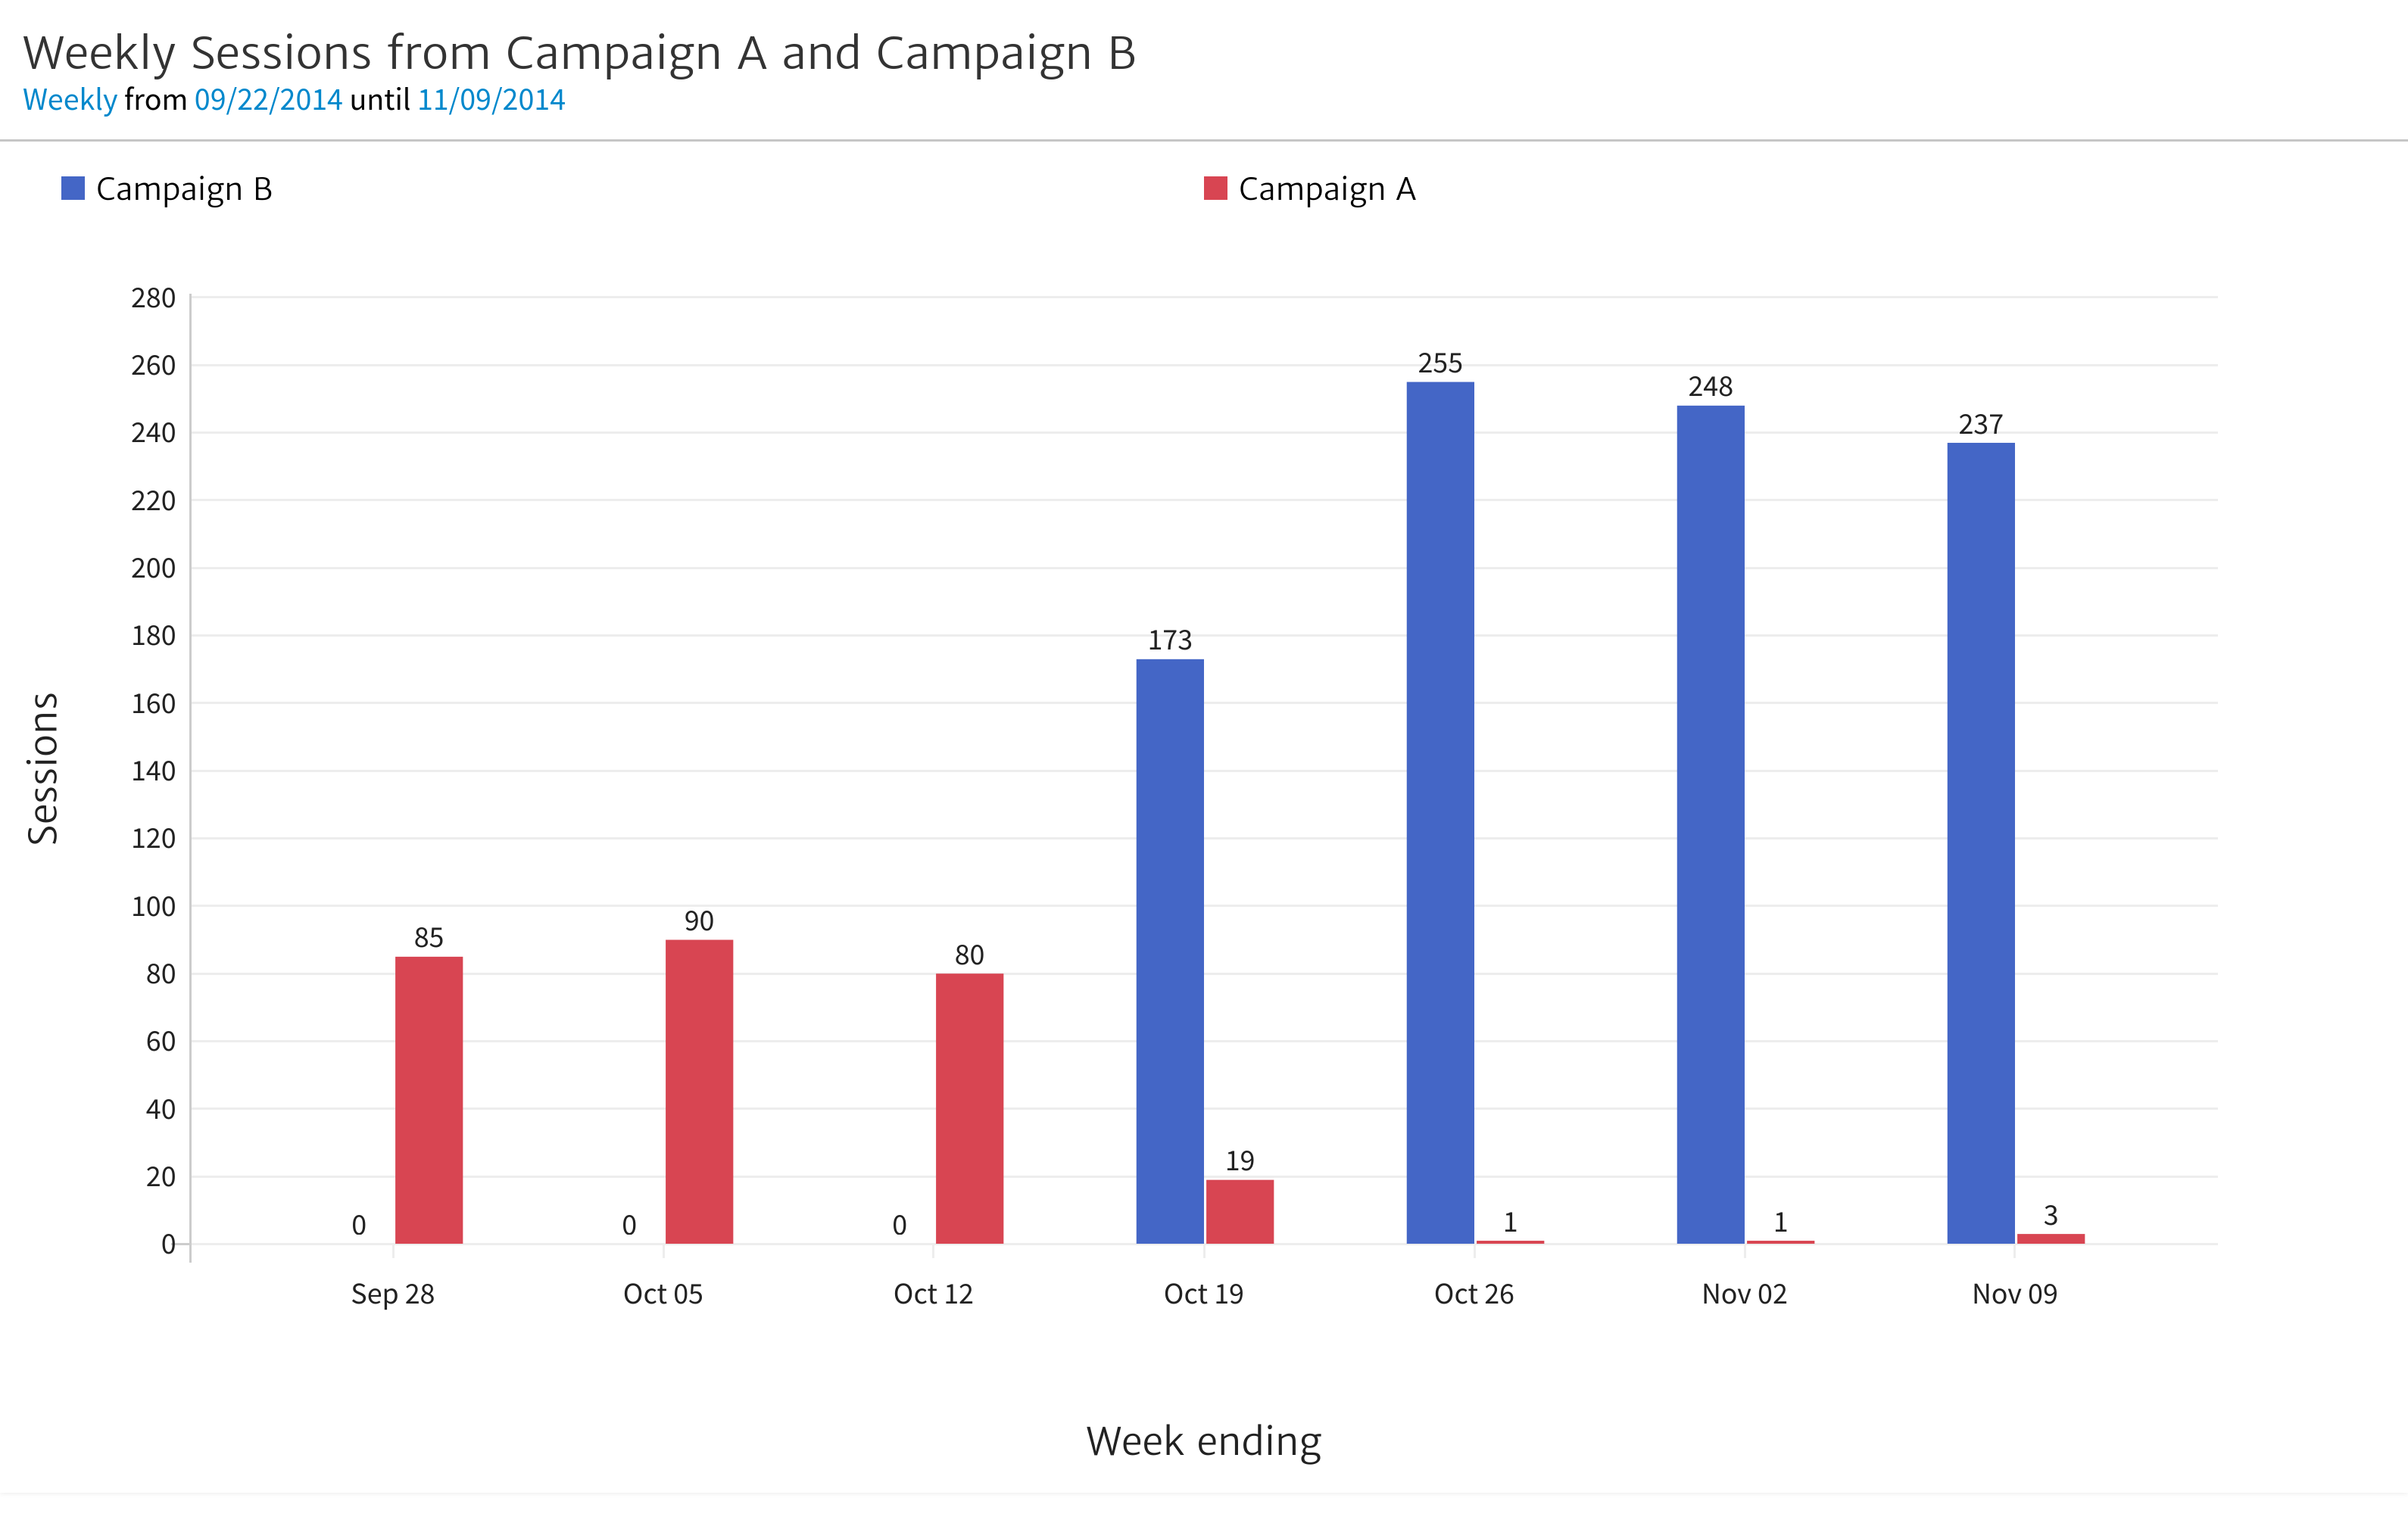
This updated chart shows Campaign B is replacing Campaign A, and actually doing much better. Along with this chart, the report would probably contain some text, such as:
We have transitioned campaigns over the last six weeks. Campaign A ran during the last week of September and first two weeks of October. Campaign B replaced it and ran during the last two weeks of October and the first week of November. As you can see, the new campaign has more than doubled the traffic to the website compared with the old campaign.
Ease of Use
Ease of use should be a key criterion as you evaluate tools. Part of the reason your agency wants to invest in a reporting tool is to streamline the process. In order to successfully do that, the tool needs to be relatively easy to use, while being powerful enough to provide the stats and charts you need.
Agencies that do client reporting well often have administrative staff or account managers handling a large portion of the process. These folks may be supported by web analysts or other data gurus who can help specify the most insightful metrics and charts, and tweak the text to explain the insights. But, the processes of getting the reports out, ensuring that they are complete, accurate, and reflect the latest data, probably ends up being the responsibility of folks who are not necessarily data gurus.
For this reason, when you are evaluating tools, be sure to include the people who will ultimately be responsible for the reporting processes. Whether they are admins, account managers, or a specialized analytics reporting group, these folks will want to work with the tools you are evaluating. Have them provide feedback on how easy (or not) it is to work with each tool, and how much time they think it would take to prepare and send out the reports. If the workload seems excessive for a particular tool, then you may need to simplify the reporting or look for a different tool.
Power
The flip side of ease of use is the power of the tool to pull the stats and create the reports your agency needs. If all you want to do is provide top-line numbers, like total site visitors, then there will be many tools that meet your needs. However, if you want to report on more sophisticated metrics – say, a comparison of conversion rates between two different campaigns – then some tools won’t be able to meet your needs. .
You should prepare a “target report,” either in Excel or by copying and pasting into Word (or Google Docs). The target report should represent your ideal client report – including all the stats, charts and features you would ideally like to include in a client report.
As you evaluate tools, test them to see if they can be configured to create the target report. You may also want to contact customer support for each tool vendor, share the target report with them, and ask if their tool can create such a report.
You may have to compromise a little bit, but the tool you select should be able to handle most of what is included in your target report. If it is hard to set up, make sure that tool provides some kind of template, or copy report capability, so that the people doing the reporting can reuse the template and don’t have to reinvent the wheel each time.
This goes back to the ease of use issue discussed above.
Branding Capabilities
For some agencies, it is very important that client reports be styled with the branding of the agency. Agencies that want to brand their client reports would not be happy with a copy and paste of a Google Analytics chart into their monthly reports. The copied Google Analytics image will not match the agencies branding and it will be immediately obvious to many customers (who may be familiar with Google Analytics) that the report was created by simply copying and pasting images.
In addition to generating the necessary charts and graphs natively within the tool, those who are concerned about branding will want to be sure that the agency logo can be displayed on a cover page. In fact, the agency may even want to include branding in standard headers and footers that appear on the cover page and/or each page of the report.
As you evaluate tools, make sure that you evaluate the branding capabilities of each so you are sure that you will be able to meet your agency’s needs.
Some Tools You Should Look At
There are several tools and approaches that you should evaluate for client reporting. Bear in mind that this list is not exhaustive, and you should do your own research to best meet your needs.
Also, big disclaimer, I am the founder and president of Megalytic – one of the tools listed below.
Megalytic
Raven Tools
DashThis
WebCEO
While there are certainly other tools about there, the above offers a good starting point.
Conclusion
The tool you select needs to fit into your agency’s reporting process, or at least the process you would like to put into place. As you embark on the process of selecting a tool, remember there is no one-size-fits-all solution to the problem of automating your client reporting. Use the criteria presented here, along with your knowledge of how your agency works, to find the right tool for you.

