Customizing Metrics
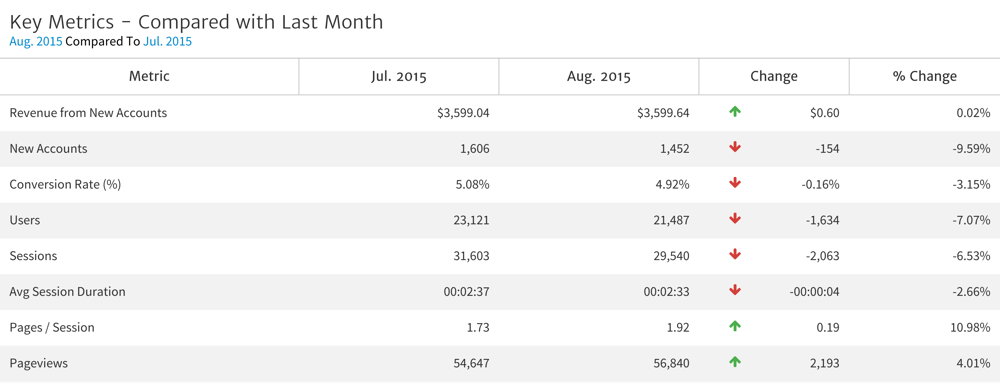
When you first add the widget, you’ll see a default set of metrics comparing last month’s stats to the previous month. A red arrow indicates a drop in performance, while a green arrow indicates an increase in performance.
In addition, the two Change columns show how stats differ from the previous period. You can see the total volume of increase or decrease (Change column) as well as the percentage of change (% Change column), which helps to put these increases or decreases into perspective. For example, a decrease of 100 Sessions may seem like a lot, but if you receive thousands of Sessions each month, the actual percentage of change may be low.
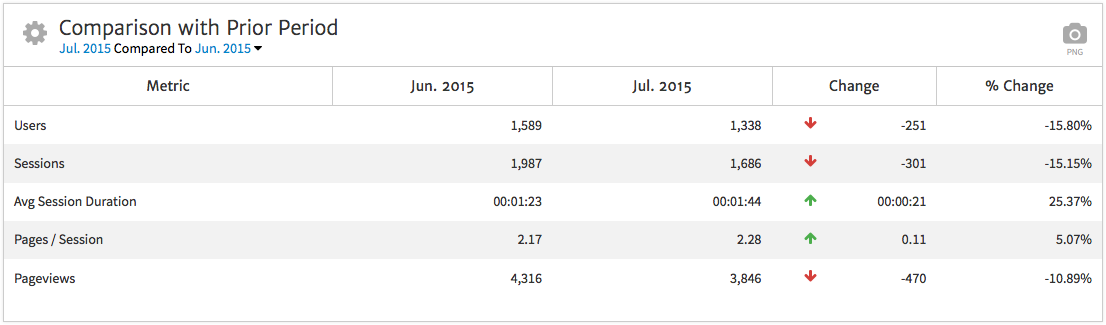
This widget can be customized to show the results most relevant to your reporting needs by selecting the gear in the upper left.
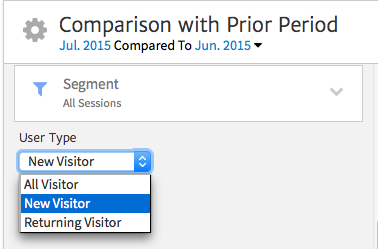
First, say you only want to show traffic from new visitors to highlight the impact you’re making on people who don’t frequently engage with your brand. Select the “User Type” dropdown to choose from New Visitors, Returning Visitors, or All Visitors.
Next, you can add or remove metrics from the default set using the “Rows” dropdown. To add a metric, simply click it in the list so a checkbox appears; to remove an existing metric, click it so the checkbox disappears.

Once you’ve chosen the metrics you want to include in the widget, click “Apply Selection” to make your choice permanent. You can rearrange the existing metrics in the report simply by clicking on the left side of each box and dragging it to the desired position.
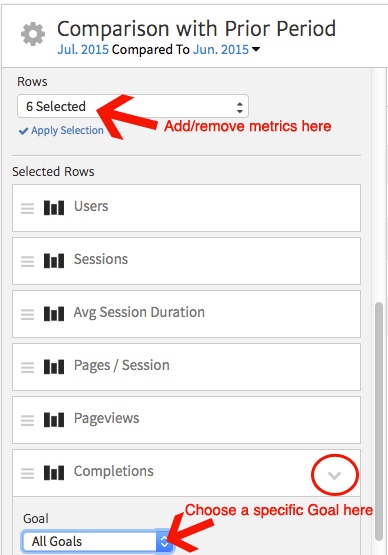
In this case, we’re adding Completions to the widget to show how many conversions took place on the site. Within this metric, you can click the arrow to reveal a dropdown that allows you to choose a specific Goal from your Google Analytics account. For instance, you may be tracking a newsletter signup form and a general contact form separately. In order to customize the widget to show only completions for the newsletter signup form, you would select that goal from this dropdown.
Customizing Date Range
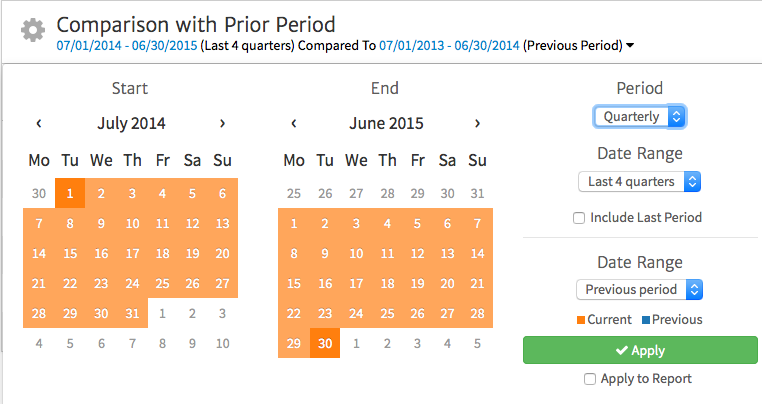
You can also customize the date ranges you’d like to compare using the dropdown from the date at the top of the widget. For instance, you may want to show stats on a quarterly level as opposed to monthly to provide a “big picture” overview of results, or choose a custom date range to measure results from a particular campaign. You can also choose a comparison date range, using default options for the previous month or year, or set a custom range.
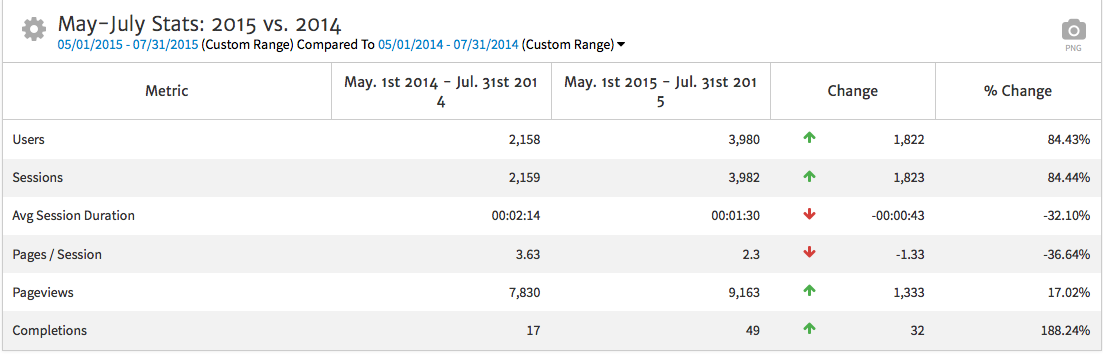
Now, we can see the final widget with the Completions row added and date range set to compare a three-month period to the same time in the previous year. Here, we can show the client an increase in overall traffic and conversions, despite a decrease in engagement (as shown by a lower Avg. Session Duration and Pages/Session). This is a good opportunity to include a Notes widget to further explain the results, noting that an increase in Completions indicates more potential leads for the business despite people spending less time on the site. This could show your customers are finding exactly what they need, quickly!
By default, the widget shows all data from the selected Google Analytics view. However, what if you want to compare stats specifically for organic search or paid search? You can easily customize the widget further using filters or Segments.
Segments & Filters
By default, Megalytic auto-imports all Segments connected with your Google Analytics account so they can be applied to any widget. In this example, we’ll customize the widget to strictly show organic search data. To do this, we’ll select the Segments dropdown.

Next, we’ll click the default “All Sessions” Segment. This will open another option to choose a different Segment—allowing you to select from both the default Google Analytics Segments and custom Segments you’ve set up. We’ll select Organic Traffic. Note that you can use the search bar to quickly filter to a specific Segment. Once we’ve chosen a Segment and applied to a report, the numbers will update to reflect the data we want to show.
What if you want to show data for a Segment you don’t have readily available? For instance, you want to show stats from a particular geographic region. You can set up a filter directly within Megalytic that will let you show the data you want without having to create a new Segment.
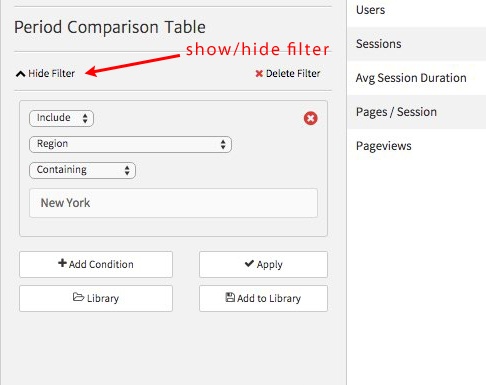
Within the widget options, select “Show Filter,” and then begin customizing your filter. For this example, we want to show traffic from within New York State, so we choose to filter by Region and enter New York into the text box. Note that you can apply multiple conditions within a filter. Now, we simply need to apply this filter to the report to update the data.
Example Use Cases
With the options available in Megalytic, you can customize the Period Comparison widget to adapt to just about any stat comparison you might want to show a client. Here are a few scenarios where you may find this widget especially useful:
- Analyzing engagement after a new site launch: add metrics for Avg. Session Duration, Pages/Session, and Bounce Rate and compare a timeframe from after a site launch to before launch (preferably after you’ve gotten at least a couple of months’ worth of data).
- Reviewing consistency of seasonal trends: compare visit volume and conversion performance from last year’s “busy season” to this year’s.
- Comparing performance of particular channels over a specific timeframe: use Segments or filters, as shown earlier, to show results just from organic search, paid search, social, etc.
Conclusion
The Period Comparison widget offers marketers a straightforward way to compare results against a previous timeframe to give clients historical context. The widget can be customized to include just the metrics you want and the particular date range you’d like to compare. In addition, you can add further customization through Segments and filters to show traffic from select channels or other criteria. By taking the time to compare today’s results to historical data, you paint a clearer picture for clients about their current performance.

