Customizing the Events Summary Widget
Upon adding the Events Summary widget to your report, you’ll see a line chart by default, representing total events for the last 13 weeks.
The Events Summary widget allows for a wide array of options for customization. You can, of course, modify the chart type and apply segments as with other widgets, but there are also a number of customization options specific to Events. Let’s look at some of those.
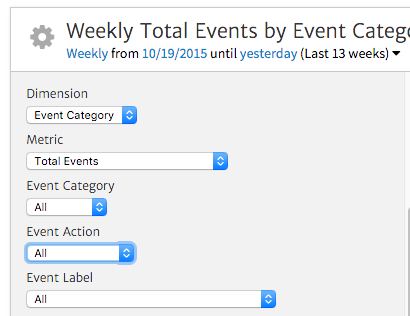
First, you can choose which dimension to show in your chart, selecting from:
- Event Category
- Event Action
- Event Label
Note that these dimensions will reflect what you’ve defined when setting up custom tracking for Events on your site. Next, you can choose the metric to count, selecting from:
- Total Events (total number of times events occurred)
- Unique Events (events counted once per Session)
- Event Value (total value per event)
- Sessions with Events (number of Sessions in which events occurred)
- Avg. Event Value
- Events per Session with Event
Finally, you can filter the data to include a select category, action, and/or label. As an example of using these options, our initial chart shows data by category, in this case correlating to PDF clicks, video plays, or outbound link clicks.
External Link Click Events
Let’s say we want to report on clicks to external links. We’ll change the Dimension dropdown to Event Label, since we’ve set up the site to report the external URL as the label. We’ll also change the chart type to Table Graph. Finally, we’ll filter Event Category to “outbound,” which delineates a click to a link off of the current site.
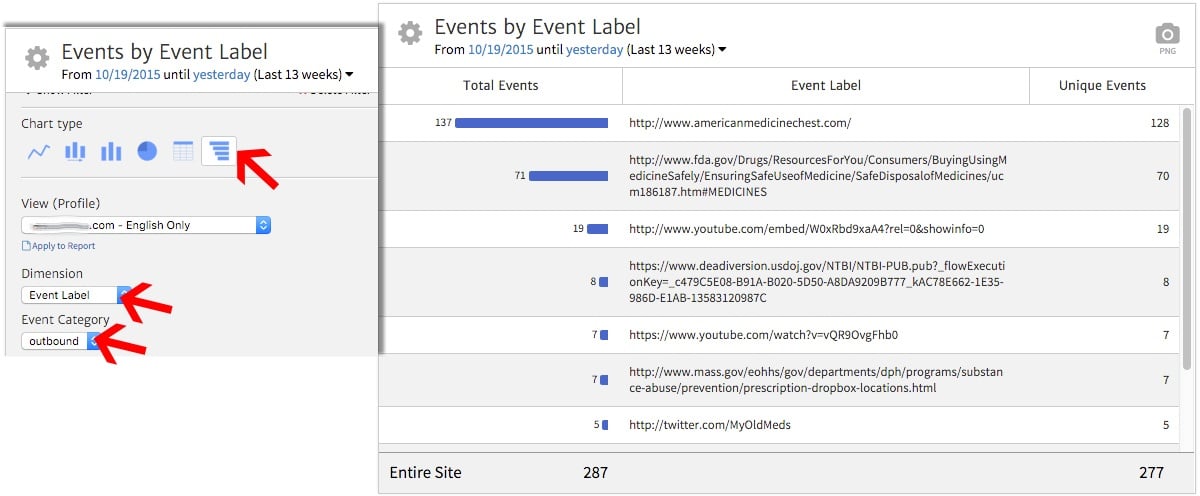
In the final widget, we see a breakdown of the URLs clicked from the site, with Total Events and Unique Events broken down for each. As you can see, americanmedicinechest.com was the most popular link in this timeframe.
Video Play Events
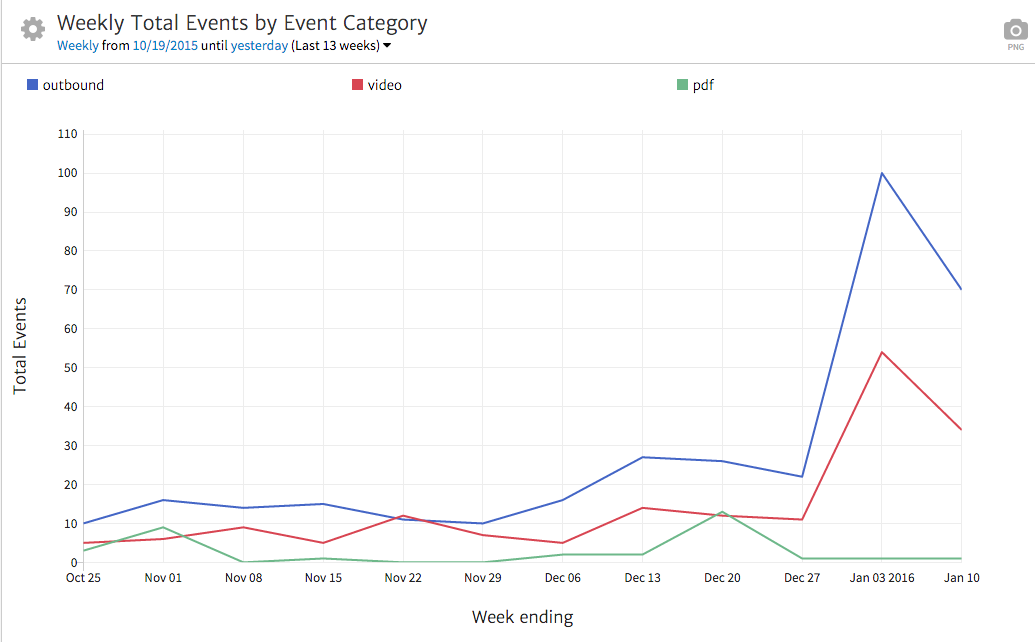
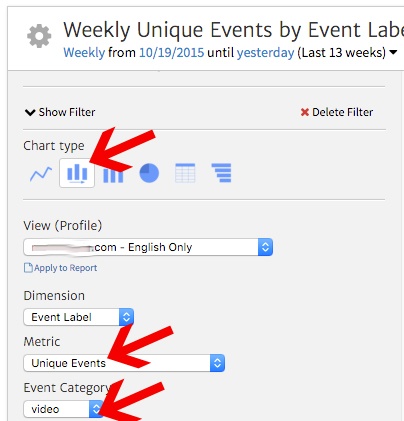
As another example, let’s say we want to track weekly video plays. In this case, an Event triggers anytime someone clicks a play button on an embedded video. We’ll choose the Time Series Bar Chart, which will show us video play Events by week when we’ve set the date range to weekly.
Next, we’ll set the metric to be Unique Events, so we don’t count video plays multiple times for people who played it more than once while visiting the site. Finally, we’ll set the Event category to “video,” limiting to just video plays and excluding other Events like offsite clicks.
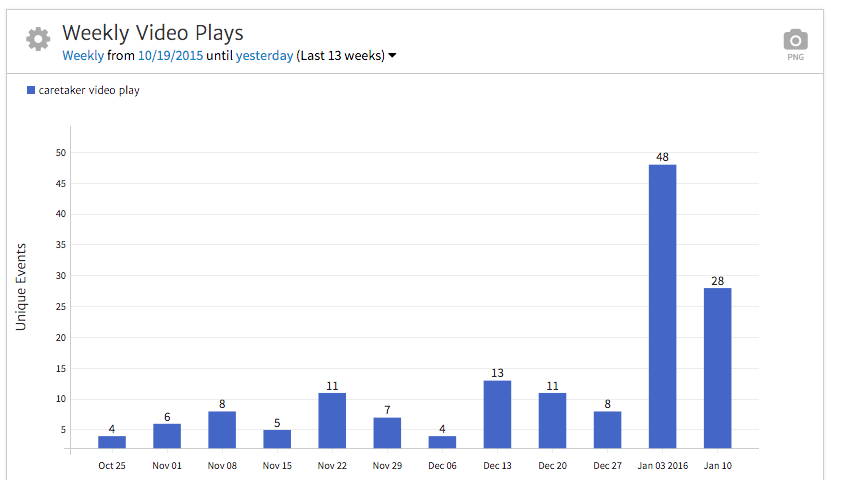
Upon saving this configuration, we’ll see the chart update to show video plays by week. As you can see, the bar chart allows you to easily pinpoint weeks when increases or decreases in volume occurred. We can see video plays spiked in the first week of 2016, which we know that for this site correlates with a boost in advertising spend driving users to the site.
Showing Events from a Specific Channel
You can filter the widget to show Events that occurred from a specific channel. For instance, you may want to show specifically how users from organic search engaged with your site. Using the Segment section, choose the Organic Traffic segment.
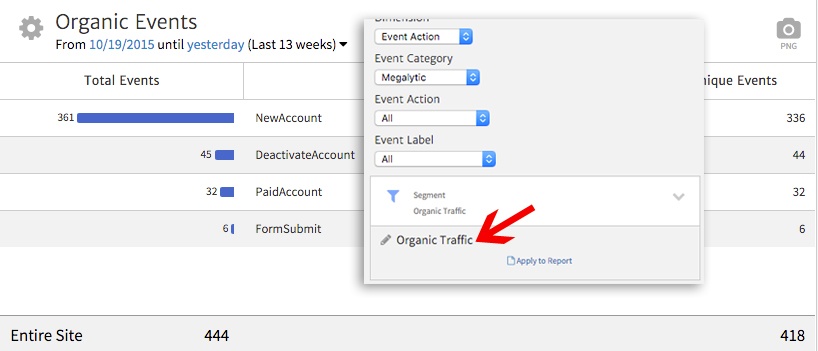
In this example, we’re showing how people from organic search interacted after landing on the Megalytic site. We can then use this data to analyze how likely people who searched for Megalytic are to sign up for a free trial account. In addition, we can look at how existing customers searched for Megalytic when they had an intent of either deactivating or upgrading to a paid account.
Reporting on Product Engagement
If you provide an online product, such as Megalytic’s reporting software, you can use Events to track how likely people are to click buttons within the site, run into errors, etc. In a report, you can show what options people are most likely to use within a product. This can serve to evaluate usability, as well as to see how well people are utilizing new features (or if they’re not using them at all).
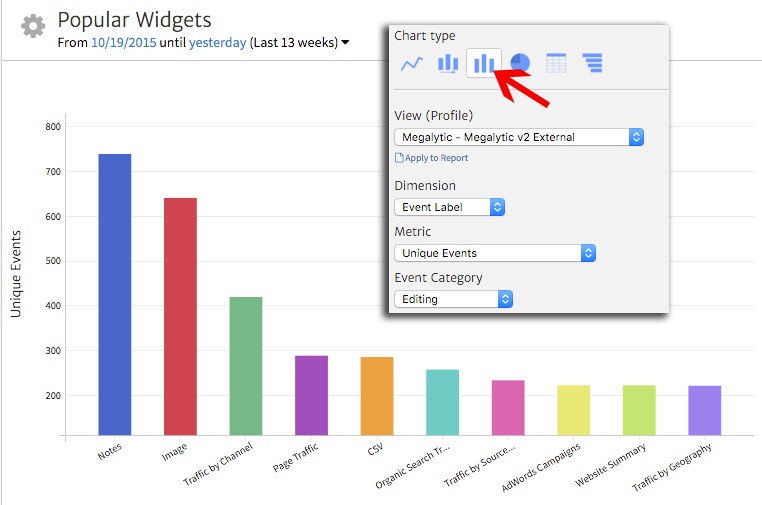
In this example, we’ll show what widgets people are most likely to use when creating Megalytic reports. We’ll choose a bar chart to show the top ten widgets, with usage tracked via Google Analytics Events.

In this case, the Event Label represents the widget, so we’ll set that as the dimension. We’ll once again look solely at Unique Events, with Editing as the Event Category (limiting events to those related to adding widgets in reports).
Here, we can see the Notes widget, by far, ranks as the most used, with the Image widget close behind. From this data, we can make decisions about what widgets to make most prominent when people are choosing from among options for their reports. Conversely, we can observe what widgets we may like to see people using but that aren’t represented here.
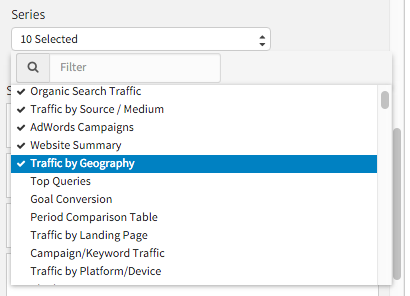
To show widgets in the chart besides the top ten, we can use the Series selection dropdown toward the bottom of the widget options. This allows us to select from all the available Event labels (in this case, widget names) to show in our chart.
The filter bar allows us to search quickly for series to add. For instance, we may want to show all widgets specifically related to conversion. Note that the widget allows a maximum of 12 series in the chart.
Conclusion
For those who have customized Google Analytics to track Events, the Events Summary widget allows a powerful way to show engagement on your client’s sites. Using the categories and labels you’ve assigned, you can report on how likely people are to click videos, visit external links, or engage with your online product.
A variety of charts allows you to compare multiple data sets, as well as to show trends over time. If you’re looking for a way to report on custom events from your Google Analytics account, give this widget a try in your reports.

