Show Conversion Performance
Why is your company or client paying for you to manage a PPC account?
What goals are they looking to achieve?
Answer these questions to help determine what information you should put front and center in a PPC report. Generally, you’ll be able to relate key goals to conversions in campaigns.
For example, the campaign’s goal may be to get users to sign up for a free trial of your client’s service. In this case, you would track a conversion as any time someone completes the setup process for a trial account. You then center the client’s report around conversion data.
When showing conversion performance, you want to include several elements:
- Total conversions, to show how many leads the business received
- Cost per conversion, to show how effective spend was in producing those leads
- Conversion rate, to show how likely people who clicked through were to convert (e.g., sign up for free trial)
- Date comparisons with previous timeframes (if available), to provide perspective on whether numbers have gone up or down
We’ll use the AdWords Multi KPI widget in Megalytic to show conversion performance. Since this is a monthly report, we’ll set the widget to show “monthly” data for the past month, which will then automatically compare stats with the previous month and year. We’ll also select the conversion-related stats we want to include: in this case, Converted Clicks, Cost/Converted Click and Click Conversion Rate.

With this setup, our widget is configured to show conversion stats compared with previous periods.
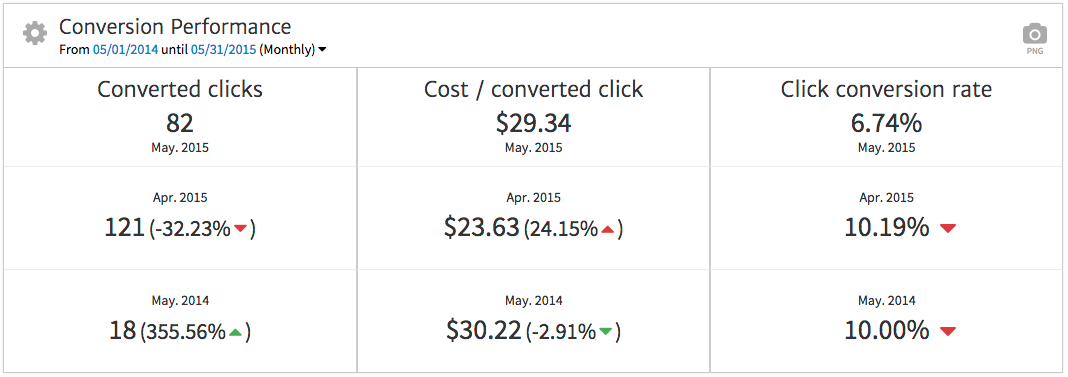
Based on this data, we can then provide additional commentary to our client about conversion performance using the Notes widget available within Megalytic. For example, we note that volume of conversions dropped quite a bit from last month, while cost per conversion increased. However, we can also point to significant improvement from last year to show that, for the long term, the campaigns show improvement despite lower performance in May.
Break Down Campaign Performance
Next, break down performance by campaign to provide your client with additional detail. For this account, campaigns break down by region, allowing the client to analyze results from each market area. We’ll use the AdWords Campaigns widget, customizing it to add a “Converted Clicks” column to the default metrics.
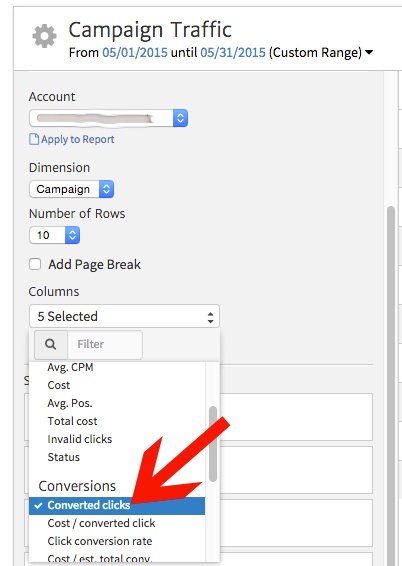
Now, we can see Clicks, Impressions, CTR (clickthrough rate), Avg. CPC (average cost per click) and Converted Clicks broken down by the campaigns driving the most traffic.
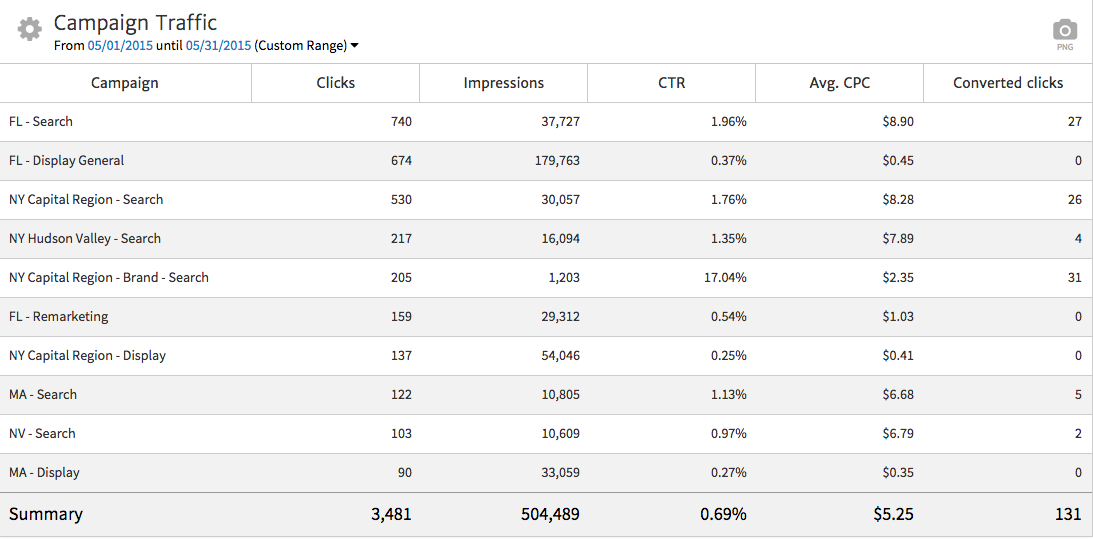
When presenting this information, you’ll want to explain what your client is seeing in more detail, providing insight into performance. Looking at regions in general, Florida appears to be the top driver for traffic overall, with New York next.
We also see that the “FL - Search” campaign drove the most traffic and was among the top converting campaigns, showing high performance in Florida. In addition, you can point out the “NY Capital Region - Brand - Search” campaign drove even more conversions, showing the value of bidding on lower cost brand terms.
Based on this data, you can discuss with your client what regions he or she perceives to be the most important, seeing if campaign priorities mesh with search volume and conversion volume shown in reports. For instance, perhaps your client would like to place a greater emphasis in expanding market awareness in Massachusetts. There may be an opportunity to add new search terms or to increase display budget for heavier branding there.
Show Performance by Network
To help your client gain further insight from the data, show performance broken down by network. Networks correlate to the places where ads run, and on AdWords include Google search, search partners and display.
Breaking down data by network is important because search performance tends to differ quite a bit from display performance. In search, users enter a query with specific intent to find a service, so they’re naturally more likely to click on ads. In contrast, display ads are targeted based on audience or page content. While the ads may be reaching a highly specific audience, not as many users will be seeking the advertiser’s service, so display ads tend to have a much lower click-through rate (CTR) than search ads.
On the search end, AdWords runs ads on Google search as well as search partners, if you’ve opted in (default setting). Search partners include third party sites where Google has agreed to place ads. Performance can vary depending on the campaign; sometimes worse than Google search, but sometimes better. You’ll want to watch activity from search partners to see how conversion volume and cost per conversion compare to what you’re seeing from Google search.
To show performance by network, we’ll add the
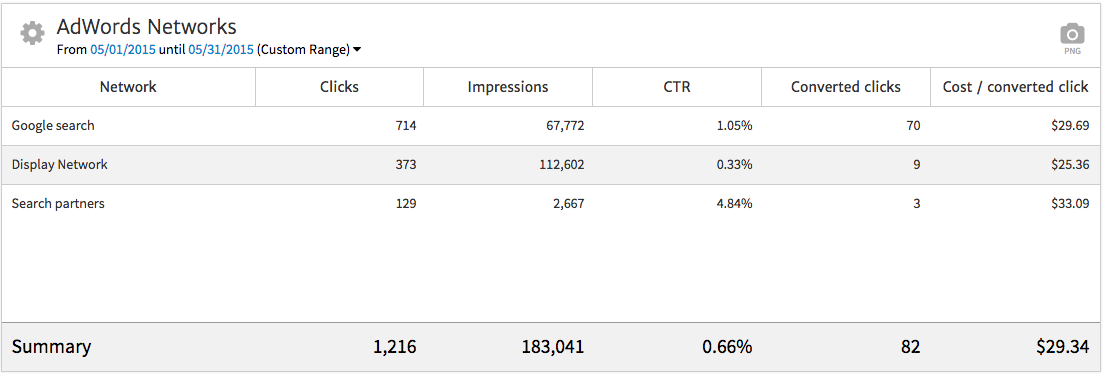
First, we can point out how dramatically click-through rate (CTR) varies among networks. Google search shows just over 1%, while the display network shows 0.33%, reflecting a naturally lower number as previously explained. Also, search partners show an exceptionally high CTR of close to 5%.
Next, we can talk about conversion data. Google search, by far, shows the most conversions of any of the networks. However, the display network shows the lowest cost conversions. Finally, search partners show the most expensive conversions, despite a higher CTR. Remember that positive data in click volume and CTR does not necessarily correlate to the best conversion data.
From this information, we may recommend turning off search partners temporarily to see if overall cost per conversion goes down the next month. In addition, we may recommend a stronger focus in display advertising.
Conclusion
Building a PPC report for your client requires knowledge of the client’s ultimate goals in running online advertising campaigns. You need to be able to correlate performance of campaigns to driving lead success for the company.
Through widgets available in Megalytic, we’ve shown you how you can break down KPIs, specific campaign stats, and performance by network into a basic PPC report that will show your client top-level stats that matter. You’ll need to add your knowledge of your client to expand with additional commentary.

