
Showing Users & Sessions
Marketers accustomed to buying billboards and TV commercials often think in terms of impressions: how many people will drive by a billboard or view a particular channel at a certain time. On a website, impressions can best translate into Sessions, how many times a website was visited; and Users, how many individuals came to a website. Every digital marketing report should include a basic breakdown of Sessions and Users over a timeframe.
However, don’t just present total Sessions. Put the metric into perspective to help the reader understand whether the results are good or bad. By comparing to a previous period, marketers can see if numbers have increased or decreased, and whether they’re trending up or down.
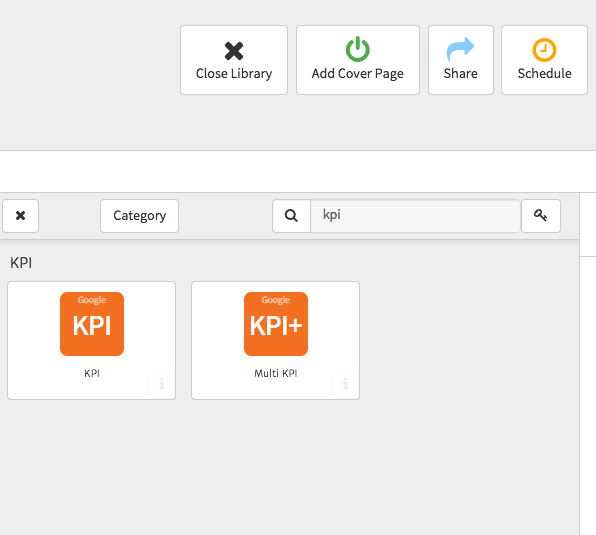
Megalytic’s new KPI widgets allow you to show data for Sessions and Users, as well as to compare to last month’s and last year’s numbers all in one place. To add this widget to your report, choose “Add Widget” and search for “kpi” to filter the list. For this report, we’ll select the Multi KPI widget which allows you to display results for up to four metrics in a single row.
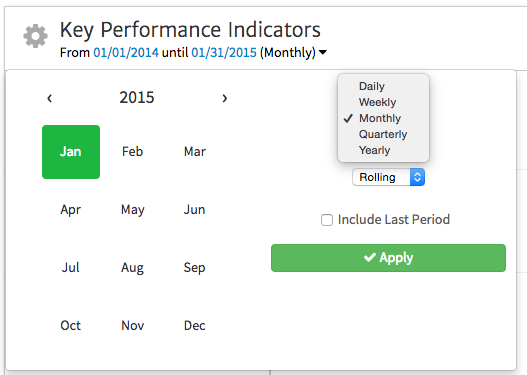
Once we’ve added this widget, we’ll change the default Weekly timeframe to Monthly in order to look at a larger period of time. To do this, we click the date range shown above the widget and, in the box that appears, use the Period dropdown to select “Monthly.”
Now, we can apply the new date range. We also would like to customize which metrics are displayed by the widget. To do this, we select the gear at the top left of the widget.
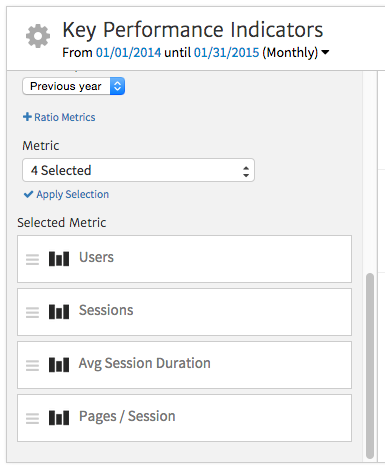
Scrolling down within the box that appears, we find a “Metric” dropdown. We’ll use this to ensure the four metrics displayed are Users, Sessions, Avg. Session Duration and Pages/Session. By default, the first three are included in the widget, so we simply need to add Pages/Session. Upon selecting “Apply Selection,” we see the final KPI widget.
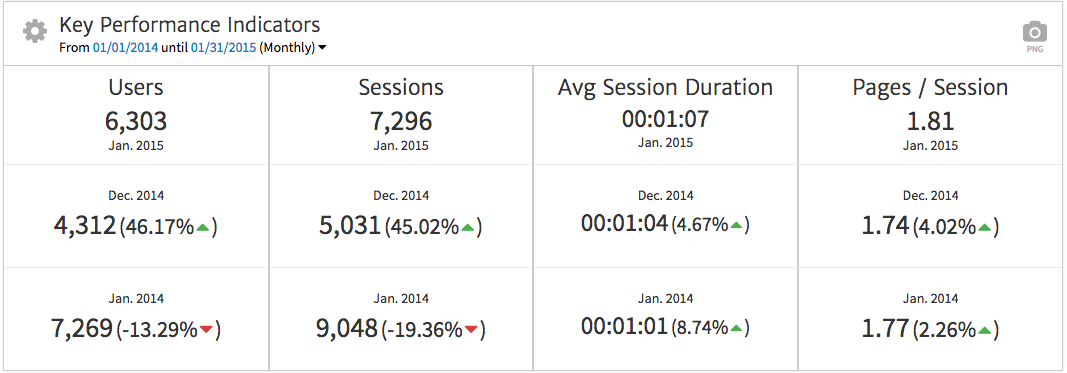
The first two columns in this widget show Users and Sessions for January 2015, comparing totals to the previous month, as well as the same period in the previous year. From this data, we see that both users and sessions have increased from December, likely due to a dip in traffic around the holidays, but are down from 2014 at the same time. This knowledge allows marketers to put the data into perspective, seeing that the website is showing a dip in traffic from the previous year.
Focusing on More Than Users & Sessions
Often, marketers stuck in a traditional mindset can get caught up on looking at one single metric. As a marketing professional, you should encourage looking beyond just one statistic. Instead of just focusing on the fact that sessions have dipped from last year, include other metrics that measure the quality of the traffic.
In this case, we’ve included metrics for Average Session Duration and Pages/Session in the widget. These numbers have improved both from the previous month and from the same time in the previous year, showing that while there may be fewer people visiting the site, they are spending more time on the site and looking at more pages.
Clients who are new to web metrics may need help understanding what many of these metrics such as Average Session Duration mean. Add a Notes widget to offer commentary defining the metrics for your readers and explaining the significance of changes from the previous month and year to the website in question.
Beyond showing Sessions, Users and engagement metrics such as Average Session Duration and Pages/Session, if possible, also report on data that relates more directly to the business’s bottom line. For example, report on metrics directly related to lead generation and revenue.
Reporting on Bottom Line Results
Traditional marketers, like all marketers, ultimately care about seeing return on investment. If a particular campaign or marketing channel is not helping to drive revenue or other measurable results, they’ll want to cut back and invest elsewhere. However, most traditional venues for advertising contain limited ability to attribute leads and sales to a specific source. Often when people discover the higher level of attribution available on the web, they see the value of investing more where they can better track performance.
To track performance, you’ll need to measure goal completions or track eCommerce revenue. Lead-generation focused businesses, which have historically relied heavily on traditional marketing, like to optimize marketing efforts to produce the maximum number qualified leads possible. On a website, these leads are likely to come through a contact form that can be measured by setting up goal tracking in Google Analytics.
Any digital marketing report for a lead-generation business should show statistics for the goal completions that directly relate to measuring leads. In Megalytic, there are a variety of Conversion widgets that allow you to select goals and can be used for this reporting.
For this example, we’ll use the Conversion by Channel widget to show how channels such as search and social media contributed to goal completions., After adding the widget, we’ll set the date range for the past month, comparing to the previous month, and click the gear symbol to open settings.
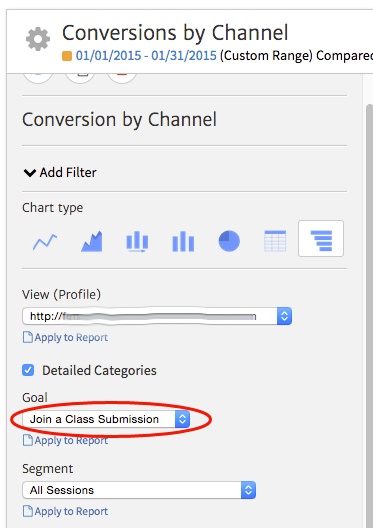
In the box that appears, we’ll then use the Goal dropdown to choose a specific goal to show. For this business, which offers fitness classes, we’ll choose a goal that represents a request to join a class. After selecting the goals and closing the widget editor, we see the final widget.
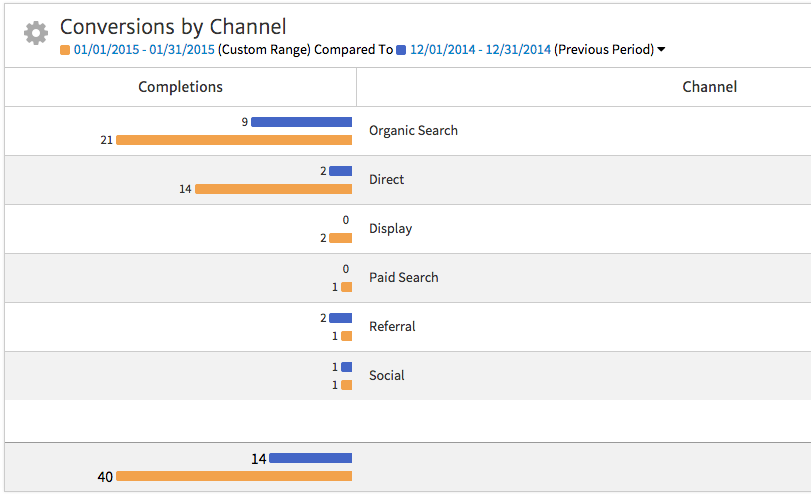
As you can see in this table, there was a significant increase in conversions (40 vs 14) from December to January. The breakdown by Channel also shows the reader where this increase came from. In this case, the rise resulted primarily from Organic Search, which more than doubled the conversions from the last month. Direct traffic also contributed to significantly more conversions.
This data lines up with additional advertising done by the client in January. This business, a local fitness studio, ran a Groupon offer, resulting in increased awareness with more people searching for the brand and accessing the site. In addition, January tends to be a time when more people are likely to be researching a place to work out to keep their health-inspired New Year’s resolutions.
Conclusion
To create a digital marketing report for traditional marketers, start by using metrics such as Sessions and Users that are analogous to the familiar concepts of impressions and audience. In addition, focus on goal conversion and Ecommerce metrics that can relate digital marketing efforts directly to the bottom line. As someone more familiar with the digital field, you should guide them to better understand what tracking is available for digital marketing and what metrics they should be looking at. Avoid simply handing them a report full of numbers and expecting them to understand immediately. Add notes to your reports to explain the data and take the time to review the reports and answer any questions they may have.

