
Identifying Trends
Using analytics can help you identify trends to inform your marketing efforts. Many businesses see customer interest increase or decrease based on seasonality. Google Analytics can show you when searches for your business niche pick up and when they drop.
To look for trends, set your desired timeframe for review and watch for peaks and drops in the graph. These points will show you when people are likely to be more or less interested in your brand.
To analyze seasonal trends, you’ll want to view at least one year’s worth of data. For example, the graph below shows organic search traffic for one year to a private college’s website. To access this report within the Google Analytics interface, go to Acquisition > All Traffic > Channels and select Organic Search from the list.
We’ve also set the graph to show traffic by week instead of by day, using the selector at the top right of the graph. This setup allows us to look at the data on a big picture level, while still getting granular enough to note peaks in the graph.
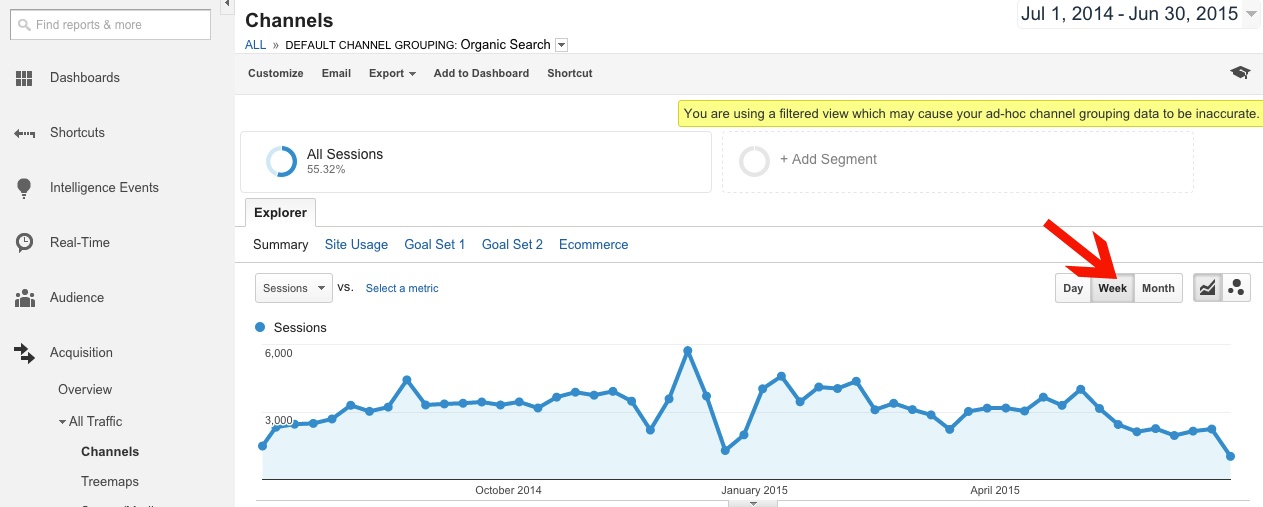
On this graph, we can note a few trends:
- Traffic picks up during the school year and drops off at the end of each semester.
- Traffic drops off significantly around Thanksgiving and Christmas.
- Searches peak right before the school year starts, as well as right toward the end of each semester. This data could reflect potential students searching for colleges at these times.
Based on this information, the college then should plan its marketing efforts around peak times when potential students might be researching the school. For instance, it appears that students are researching right at the end of their school year or near the beginning of a semester, attempting to finalize a last minute school decision.
Trends may also occur on a less macro level, such as by day of the week or month. In this next example, we see the registration cycle for a SaaS product over a two-month period.
We’re viewing conversions (Conversions > Goals >Overview) with a specific Goal selected. Also, note that here we’re portraying the graph on a daily level to show more granular trends.
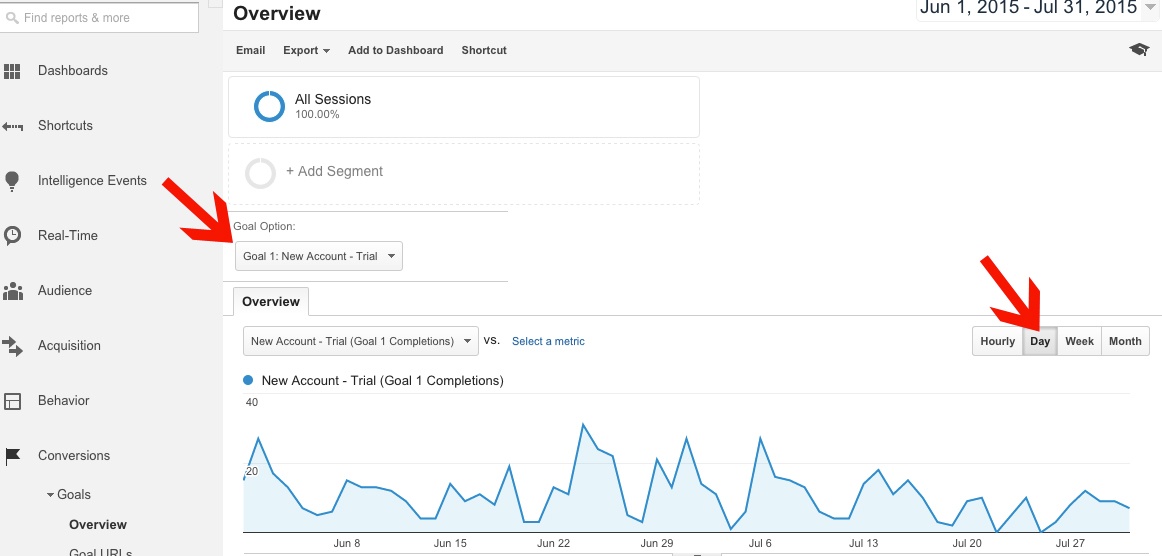
Of course, stats may vary over time, but we can make some general observations from the data:
- Most conversions occur on weekdays, when people are in the office and more likely to be researching a B2B product.
- Conversions peak around the beginning and end of each month, dropping off around the middle of the month.
From this data, we can determine that we should focus more heavily on marketing efforts such as paid search and social media posting around the beginning and end of each month.
Learning Your Customers’ Research Process
Besides learning when your customers are most likely to be looking for your company, you can also use analytics data to learn about how they are searching for your services. Ultimately, what they type into a Google search can be used to help you understand their process of researching a company with which to do business.
If you have connected Search Console to Google Analytics, you can view organic search queries directly in Google Analytics. Go to Acquisition > Search Engine Optimization > Queries. Note that you’ll only be able to see data for a 90-day period.
Once here, you’ll want to exclude your brand name, since most of the top queries will likely include your company’s name. To set up a filter, click “advanced” right below the graph. Within the options that appear, choose “Exclude,” select “Query” from the dimension dropdown, and set the next dropdown to “Containing.” Next, enter your brand name in the text box.
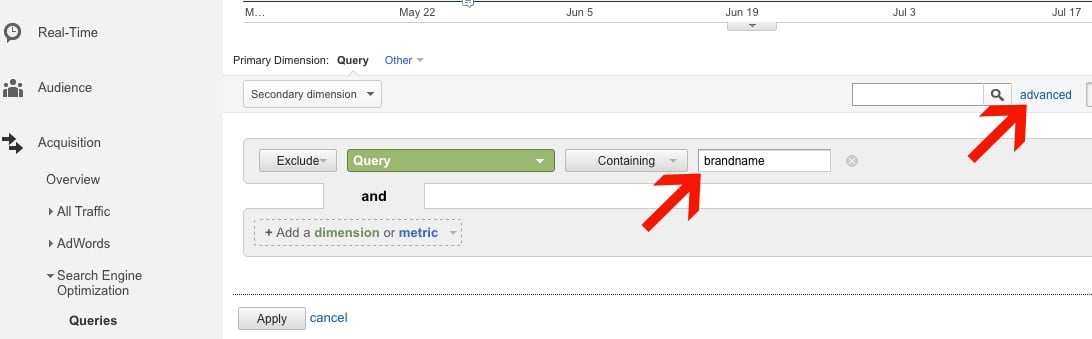
Note that if people commonly misspell the name, you may need to add additional filters. Click “Apply,” and now you should only see non-branded queries.
Click the header on the “Impressions” column to sort by the most popular searches. Here, we can see queries for an HVAC company.
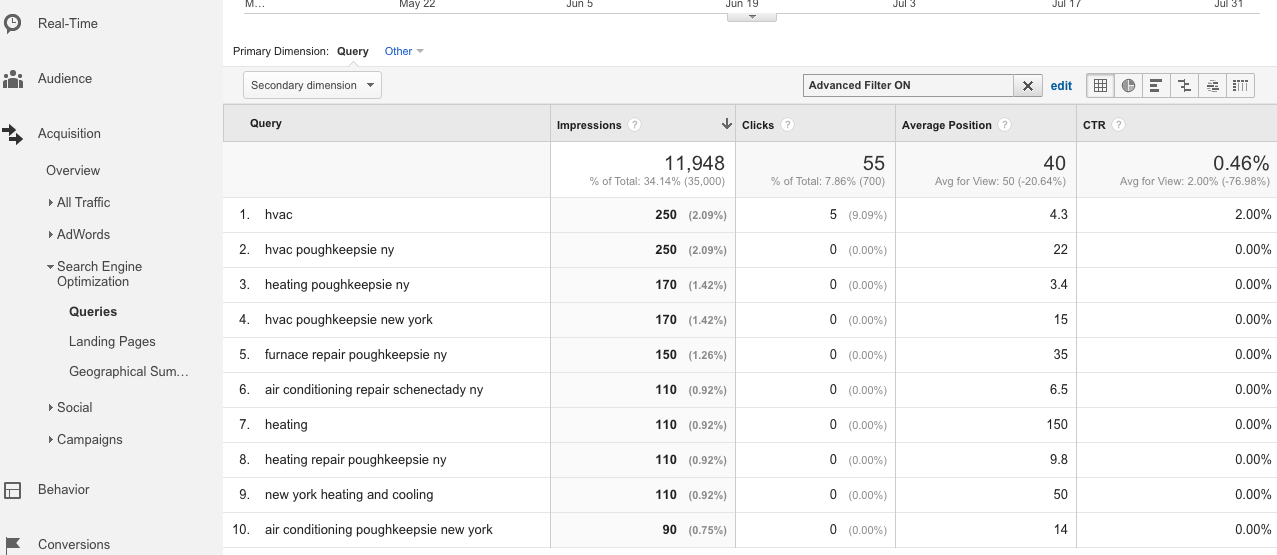
Looking at this data, we can take away observations about how people are searching for a heating and cooling company:
- Simply typing in “HVAC” is the most popular method of searching. In addition, two popular local searches include “HVAC.”
- Those looking to repair heating units are more likely to use a term with some variation of “heating,” but many are using “furnace” as well.
- Seven out of the top ten terms include town names.
Overall, we can see the need to optimize site copy around a variety of terms related to this industry, not just talking about being an HVAC company but also working in mentions of heating, furnaces, and air conditioning. In addition, we can see the importance of focusing on location mentions where possible in copy, since many consumers are searching for long-tail terms, including town names (like Poughkeepsie).
Learning from Customer Activity on Your Site
Next, you can make more informed decisions about marketing your business’s offerings by looking at where customers are going on your site. By seeing what pages they look at the most, you can determine what products and services they are most interested in.
To view the top pages, go to Behavior > Site Content > All Pages. If you want to look at a specific subset of pages (in this example, academic programs for a private college), enter the appropriate portion of the URL into the filter box below the graph.
This method of filtering will, of course, vary from site to site. In the example below, we’ve entered “programs/,” which is contained in all the URLs specific to academic programs.
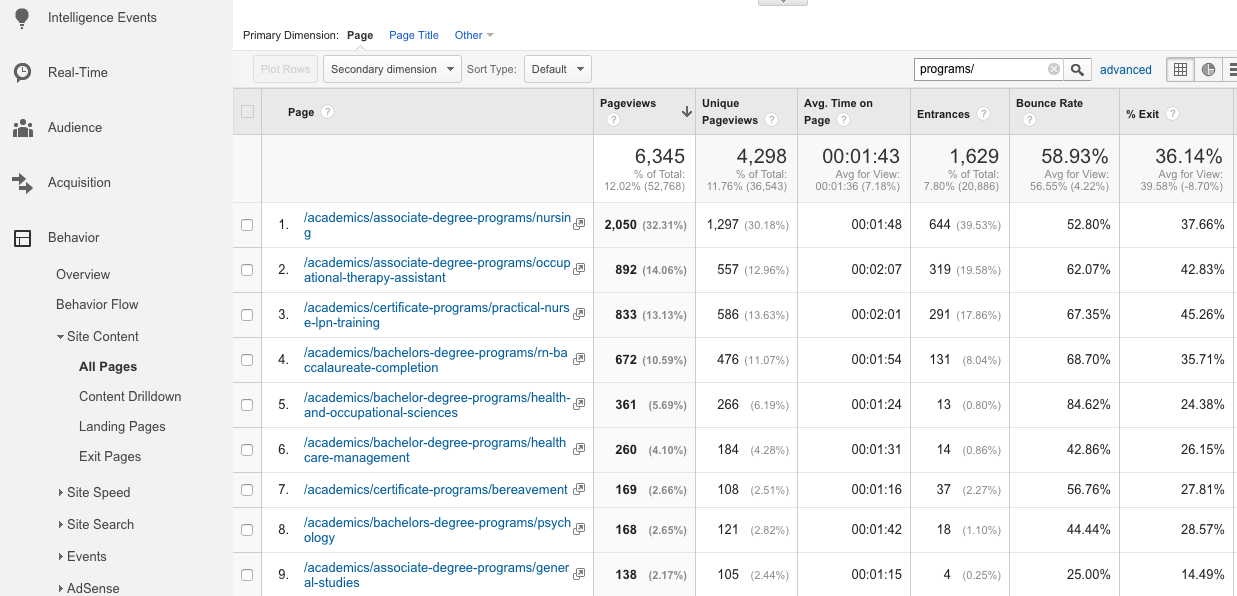
Here, we can see that the nursing associate degree program by far ranks as the most popular based on pageviews, followed by occupational therapy. Based on this data, we can report success on promoting the nursing program, while also identifying the opportunity to promote other programs more heavily. For example, if the college wants to promote the psychology program since the nursing program is naturally getting interest, we can recommend putting paid search and social efforts toward promoting psychology.
Conclusion
Google Analytics offers much opportunity to help you make more informed business decisions. Through website data, you can identify trends in performance to know when your best times are to advertise. In addition, you can learn specifics about your customers, knowing how they’re researching your brand, as well as what products and services they’re most likely to view on your site. Using this data, you can better plan your online marketing efforts.
This post has given you a start toward making data-driven business decisions. To go even deeper, check out the Google Analytics category on our blog!

