What is Automated Reporting?
Essentially, automated reporting is the process of using a regularly recurring system to create, populate and distribute reports that are generated based on pre-set time frames. These reports may involve templates or software and may occur weekly, monthly, quarterly, annually or at custom intervals.
But for those who prize the custom nature of data analysis as it applies to different clients and different scenarios, the words “automated reporting” may be cringe inducing. It may seem that the automation of marketing reporting is the antithesis of quality reports.
So, what if we reconsider how we think about report automation? What if it’s not an all or nothing, churn and send situation? What if, you could automate the assembly of data in a format that still allowed for customization and deeper dives?
What if we were to reconceive reporting automation as automating the process of building reports, while giving you the time and flexibility to spend more time on analysis than gathering and formatting your data? Sounds pretty good, right? You can try it out yourself with a Megalytic 14 day free trial now, or stay with us and we’ll talk more about what report automation looks like in practice.
The Dynamics of a Monthly Marketing Report
A marketing report is not a static thing. But let’s say your marketing department wants to track some basic metrics each month, to review them compared with historical results. They may also want to see detailed analytics on the top campaigns – and these campaigns may change each month. With some automated reporting options, both needs can be accommodated.
For example a few standard metrics with historical comparisons might be:
- Key Metrics – Compared with Last Month
- Daily Traffic – Last 6 Months
- Top 10 Campaigns – This Month
The population of this data can be automated because these metrics will be monitored and reported each month. The data and the date ranges in these charts/tables may change, but their definitions are the same. This sets the basis of a template for regular reporting.
But, what about data and campaigns that may not be the same each month? For example changing campaigns might include:
- Customer Appreciation Event
- Seasonal Specials
- New Product Announcements
These may be specific campaigns that the company ran during the current month or quarter that warrant deeper analysis because they are cross-channel and/or generate a lot of traffic. They may also have had high visibility with other teams during the month and you’d want to show how they performed.
The second group represents the kind of data that would change month to month. In order to report on these types of changing programs you need some flexibility in choosing which campaigns to include in each month’s report. To “set and forget” this would be a disservice to your team and your client. So, what do you do?
Using an automated reporting platform based on templates, but with a high level of customization, will let you automate the portions of the report that repeat from month-to-month, while retaining the flexibility to update changing campaign statistics to report data on new campaigns as they roll out. In some cases you can even drill into specific metrics like conversions or traffic associated with important campaigns.
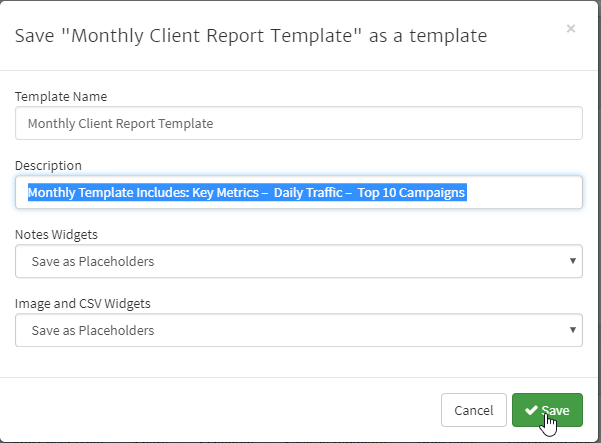
With a platform like Megalytic, you can create a report once, and then save it as a template. Once saved, you can recreate that report and modify it as necessary to meet the changing needs of the business. The right templates and platform will allow you to automate the portions of the report that repeat from month-to-month, while retaining the flexibility to update the campaign statistics to reflect the new campaigns that roll out.
Automated Reporting vs. Dashboards
One thing that often comes up is the difference between an automated report and a dashboard, like the kind you can set up in Google Analytics. While dashboards are an effective at-a-glance method of reviewing data as it applies to multiple channels, sources, audiences etc. For someone who isn’t well versed in analytics, they might as well be the control panel of a commercial airliner. The dashboard alone doesn’t automatically answer the questions, “what are these numbers and what do they mean?” In many cases the dashboard is a more effective tool for an analyst to quickly note patterns and trends, but don’t allow for the requisite commentary that comes along with monthly client reporting.
Monthly reporting can be challenging to automate because the reporting needs of clients and colleagues change over time. As illustrated in the example here, the October report is similar to September, but the campaigns have changed. With Megalytic templates, you can automate the repetitive components of the report, while retaining the flexibility to update specifics like campaigns. This style of automation is not completely “hands-off,” but is still much faster than exporting data to Excel, re-building custom charts and tables, and pasting into a Word document each month.
Beyond that, what about the data you have that isn’t in Google Analytics? For example, ranking reports, traditional marketing reports or the specifics of social media campaigns? These may all be areas where you find yourself aggregating spreadsheets and insights and pulling them together with analytics. Automated reporting platforms can help with some of this by connecting to different data sources or providing upload integrations that help reduce the amount of time copying, pasting and formatting into non-automated documents.
Choosing Reporting Automation Platform
So let’s say we’ve sold you on the idea that there are better ways to use your time by automating your monthly reports. What now? Obviously we recommend taking Megalytic out for a spin. But objectively, of course, there are other options. For example Excel spreadsheets can be automated. Google Spreadsheets can also be automated by using codes or APIs. But if you’re looking for something built for the exclusive purpose of automating and communicating regularly reported data, you can find those too. But the real question is what to look for. Here are some of the basics:
Flexibility – A running theme here has been the necessity of the ability to customize templates and individual reports based on changing needs and goals. Your ideal platform will give you control over both the data and the presentation.
Commentary – Another element that separates a reporting platform from a dashboard is the ability to insert notes and narrative as it applies to any particular data set. Do the conversions by channel show a spike in email conversions? It’s important to be able to note that a campaign went out this month, and what it included to be able to give context to that number and also inform strategic discussions around the next email campaign.
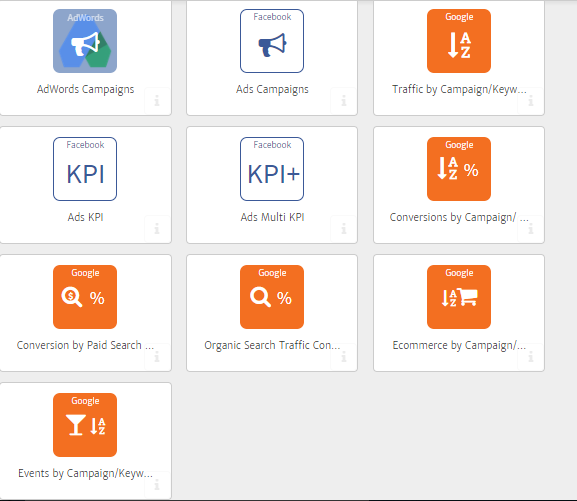
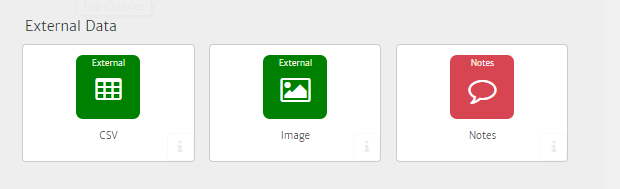
Integrations – It’s also important to have a platform that allows you to bring in data from multiple sources, like Google Analytics, Search Console, AdWords and Facebook. Additionally, it’s a bonus if the program has the capacity to use non-integrated external data sources, form images to CSV files that may be relevant to your recent work.
There are always other considerations like historical archiving, the size of your business or client base and whether or not you’ll actually make use of all of the features a platform may offer. But these “big three” should help form the foundation of your selection process.
Conclusion
Monthly reporting can be challenging to automate because the reporting needs of our clients and colleagues change over time. But with the right platform, you can automate the repetitive components of the report, while retaining the flexibility to update specifics like campaigns, sources and narrative. This style of automation is not completely “hands-off,” but is still much faster than exporting data and manually assembling it each month. An automated reporting platform allows you to focus on the things you love, like using data to drive results.

