Correlate with Metrics They Understand
Before you can communicate the results of your online campaigns, you need to help your client understand these new-to-them digital metrics. Start by correlating the metrics they’re used to, with their digital marketing counterparts.
For example, with paid search, your client may understand that an “impression” means a potential customer saw an ad. However, the client may not realize that in this case an “impression” means someone actually searched for a phrase relevant to the business, triggering an ad to show in search results. You’ll want to specifically explain how online metrics can be used to indicate consumer activity. Clients more accustomed to marketing via billboards may not be aware of the level of engagement and conversion tracking available with web analytics, so a certain amount of education will be necessary.
Think about the metrics your client considers important for the business and relate digital metrics as specifically as possible. For example, if a marketer runs a physical storefront but has just begun selling products online, this person cares about foot traffic to the store, physical engagement with products in-store and, ultimately, the number of purchases taking place at the register. You could correlate metrics the following way:
Session = a visit to the store
User = a customer who visits the store
Avg. Session Duration = average time spent browsing in a store
Pageviews = products on the shelf that the customer looks at
Goal = the customer checking out at a register
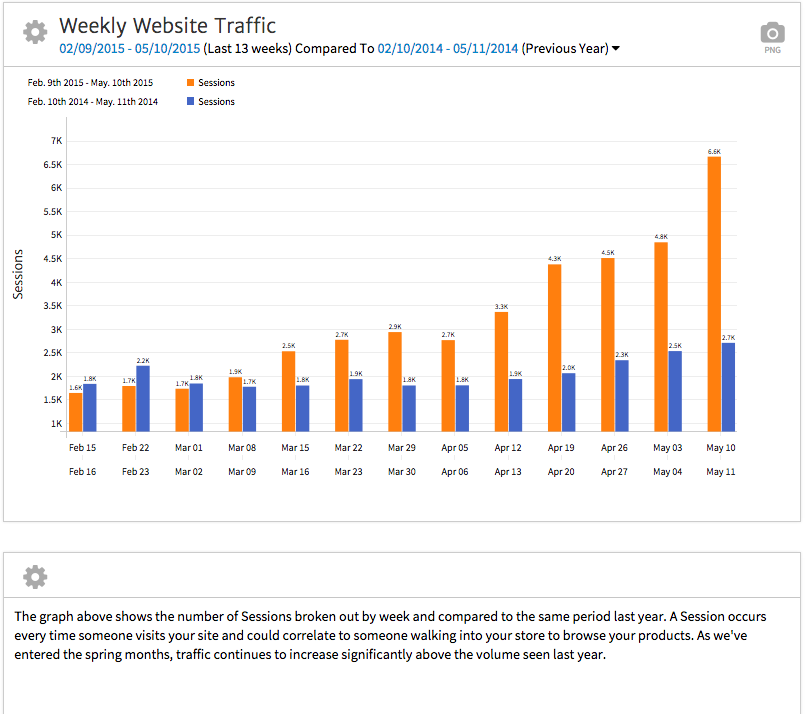
To help explain digital metrics, include notes in your reports beyond just showing the numbers. We find adding notes helpful to all marketing relationships, but it’s especially helpful to someone new to understanding the specifics of web analytics. This is why Megalytic offers a Notes widget allowing you to easily provide further content within your reports to elaborate on the data. For example, the Notes widget below expands on data representing Sessions by week.
Relate Metrics to Their Business’s Bottom Line
Ultimately, all marketers are most concerned with their return on investment. They want to know how the numbers they’re seeing relate to the financial success of their business. To better communicate the impact on financial success, make sure to include metrics that speak directly to leads and sales. This includes setting up Analytics Goals that track website actions important to the business’ financial success and sharing them with the client. Megalytic’s KPI widget helps to provide marketers with quick, high-level numbers.
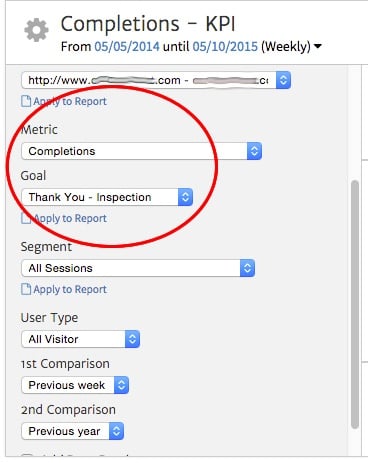
In this example, we’ve set up a KPI widget, using dropdowns to measure Completions, and we have selected a specific Goal. This will allow us to show requests for an inspection from a pest control company. To help our client understand what we’re measuring, we’ll rename the widget to have a less abstract name than “Completions - KPI” (which is bound to be more confusing than helpful) to help our client understand what it’s referencing.
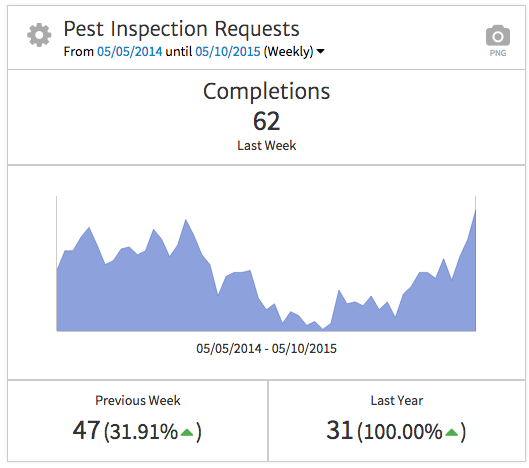
In the final widget, we can see that this company received 62 inspection requests in the past week, up nearly 32% from the previous week, reflecting warm weather driving pest activity. However, we can also see that requests have doubled from the same time in the previous year (31 last year vs 62 this year), reflecting overall improvement in website performance for driving leads.
Show Results by Channel
While it may take some time for your client to understand the nuances of online marketing channels, they’ll immediately want assurance their money is being well spent. That means understanding how each channel is performing.
The client has invested in billboards, direct mail and TV advertising in the past, and is now adding paid search, search engine optimization and social media to the mix. Which marketing activity is most contributing to brand awareness and sales?
In showing results by channel, you can emphasize how much more data is available online than in traditional marketing mediums. While a billboard provides only vague metrics like how many people may drive past it each day, website data can show you not only how many times people visited your website, but how many of those people spent significant time on site and what they did.
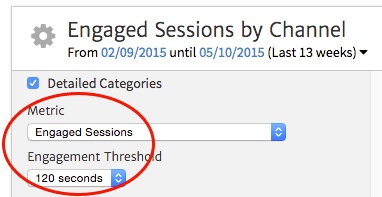
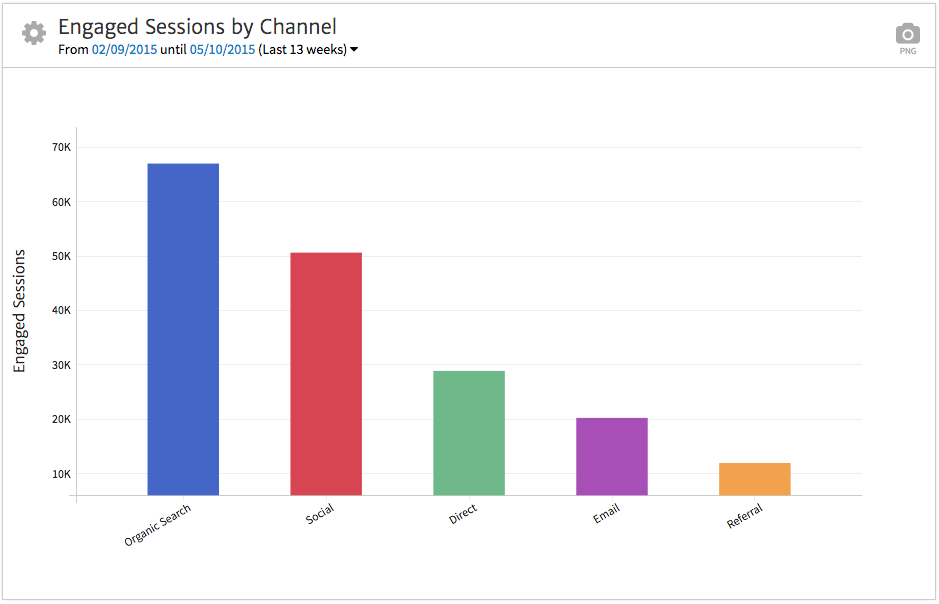
The Engagement by Channel widget helps to show this specific data for your client’s website. To customize this widget, we’ll select Engaged Sessions as the metric and set the threshold at 120 seconds. This means the graph will only count Sessions that have lasted over two minutes, enough time to indicate people are showing interest beyond a casual glance at the brand.
From this data, we can see that organic search drives the most Engaged Sessions, followed closely by social media. For this particular site, this data reflects the value that people are finding in content relevant to wellness and healthy living. Content worth reading will rank well in search as well as gain shares on social media, driving traffic and engagement upward.
Don’t Just Send a Report
The relationship between yourself and your client should entail much more than sending off a link to a report each month. You should take the time to talk with your client, whether over the phone or in person, to ensure that he or she understands all metrics being presented in the report and what these metrics mean to the larger campaign. For clients who are new to digital marketing, you’ll want to set aside even more time to help educate them on reporting and how to decipher what the metrics are telling them.
In addition to understanding the results you’ve chosen to show, your client may have more questions about the campaign’s performance. Your client may look to you to recommend whether or not to continue budget in paid search or search engine optimization, or how to improve ad click through or get more engagement on social media posts. You should prepare not only to show the data but also to make suggestions for improvement based on the data’s insight. Your client is relying on your experience to help them understand not only what the data says, but how that data can be used to make adjustments to the campaign.
Conclusion
Helping clients make the move from traditional marketing to digital means first helping them to understand new digital metrics. That takes much more thoughtful effort than merely sending along numbers and graphs. Instead, select the data that best relates to your client’s concerns, present it in an easy-to-read report format, and then include notes throughout the report to define metrics and to help your client understand what the data means.
In addition, be ready to make recommendations from the data, letting your client look to your knowledge of digital marketing. Be patient with questions from your client, knowing that online metrics are a completely new topic. Traditional marketers can quickly become supporters of digital marketing with the right data and the right support.

