Facebook Ad Click Metrics
When you create a Traffic campaign, one of the most popular campaign formats, Facebook Ads Manager will default to showing Link Clicks in the Results column. Link Clicks include clicks to the primary intended destination for an ad (either an off-Facebook website or an internal Facebook experience, depending on the type of ad).
These differ from the Clicks (All) metric, which can include clicks on any portion of an ad besides the link, including the business page profile, reactions, or comments. As long as your goal is to drive people to a webpage (such as a blog post or landing page), Link Clicks provide a much more accurate picture than total clicks to track the desired user action. In addition, look at Unique Link Clicks to pinpoint how many individuals actually clicked, as some people may have clicked ad links two or more times.
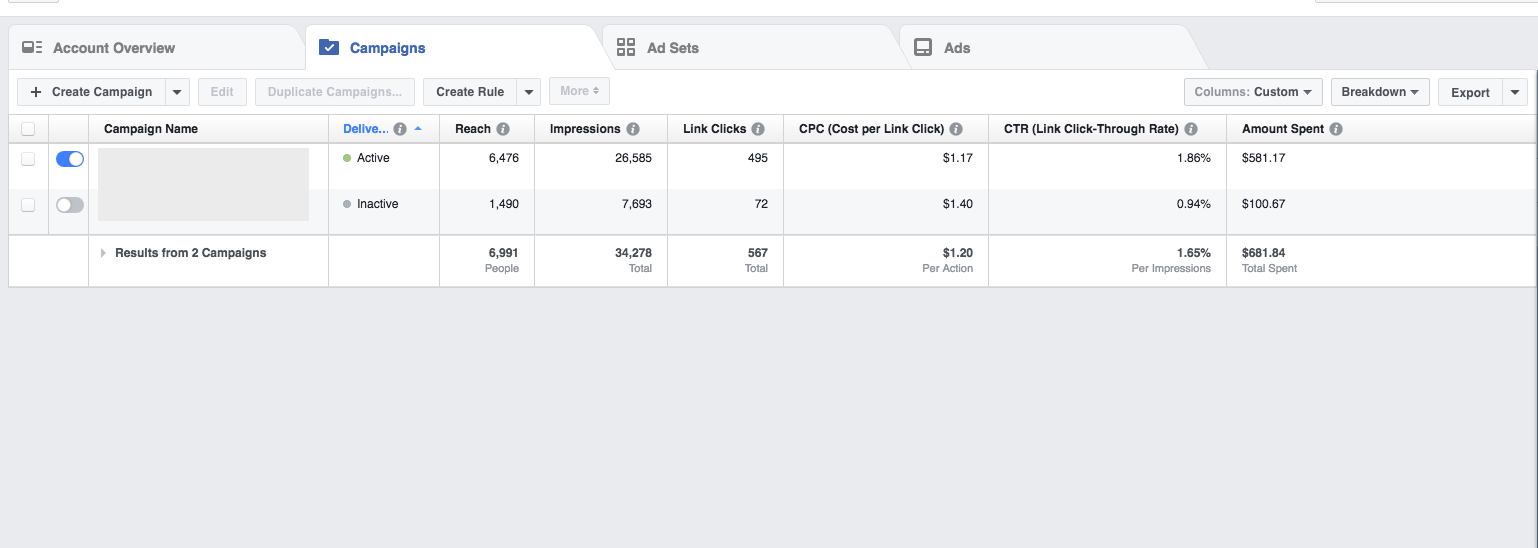
In the same vein, look at CTR (Link Click-through Rate) instead of CTR (All) to provide a more accurate picture of how likely people exposed to ads were to click through to the site. Finally, note that you can also view CPC (Link Cost Per Click) in addition to CPC for clicks as a whole.
Impressions, Reach, & Frequency
Impressions have been at the core of ad reporting for as long as online ads have existed. However, total impressions alone are a rudimentary metric; they ultimately only tell you how many times an ad showed up on a page (Facebook says they count an impression from the moment an ad appears, which could mean a very brief window of time).
Facebook’s Reach metric helps you narrow total impressions to the number of individuals who were exposed to an ad. Because Facebook requires everyone to be logged into an account while using the platform, Reach can accurately pinpoint people vs. an ad simply appearing.
Also look at Frequency to determine how often the average person is seeing an ad. If the same individuals are viewing ads 10 or more times, you may want to change messaging or shift targeting to avoid overloading people with repeat ads.
Conversions
As with other metrics, Facebook offers an array of options for measuring conversions that can easily become confusing. While the granularity helps you pinpoint various types of conversions, the number of metrics available can quickly complicate reporting. Being able to pinpoint clear numbers is especially crucial when you’re reporting on conversions, the number of leads or sales that resulted from a campaign, which relate directly to the client’s bottom line.
If your campaign is lead-generation focused, use the Website Conversions metric. Of course, this metric requires that you set up Facebook conversion tracking on your site first. This will count total conversions tracked on your site.
Other conversion metrics break down specific types of conversions. Each one is defined in the process of setting up the conversions or the event code on your site. The categories include leads, registrations, content views, searches, or purchases. For an ecommerce site, you can set up conversion actions to measure every stage of the purchase funnel, from “add to cart” to “checkout” to “final purchase”.
Also include Cost Per Website Conversion to determine how much, on average, you’re paying for a lead. For ecommerce, look at Cost Per Website Purchase as well as Website Purchases Conversion Value. These metrics will help determine if you’re maintaining an efficient cost for results while also deriving a reasonable return on investment.
Facebook does not include a Conversion Rate metric, which is helpful to determine how likely clicks are to result in leads. However, you can determine this number yourself by dividing the number of link clicks by the number of total conversions.
Video Metrics
When running a video campaign, brands are often focused more on generating awareness than driving immediate conversions. Facebook offers several metrics to determine how well people engage with video content. Once again, impressions aren’t enough, since they just show if people started watching a video. You want to know how long people watched videos and how likely they were to complete a video or take an action.
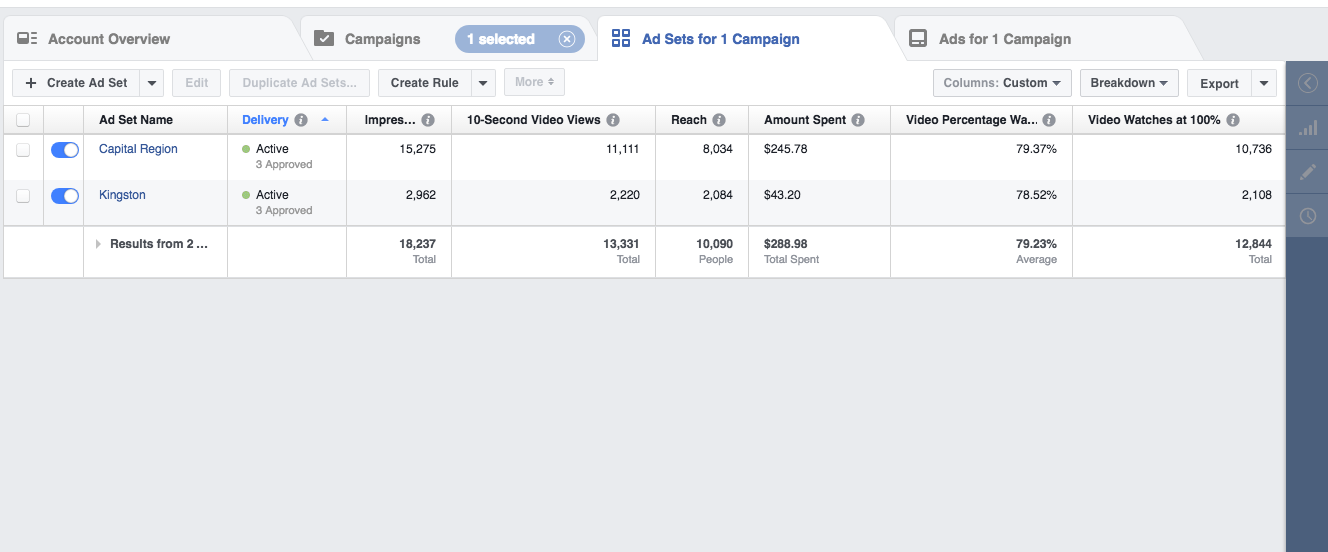
When reporting on views for a video campaign, point to Video Watches at 100% to show how many people actually watched through an entire video. Depending on the length of the video, you can also see the number of people who watched up to 3, 10, or 30 seconds into a video. This will help show how many people were exposed to enough of your brand’s messaging to understand what was being promoted. Note that Facebook charges for a view after 3 seconds are watched. Finally, use Video Percentage Watched to show the average amount of the video viewed.
Conclusion
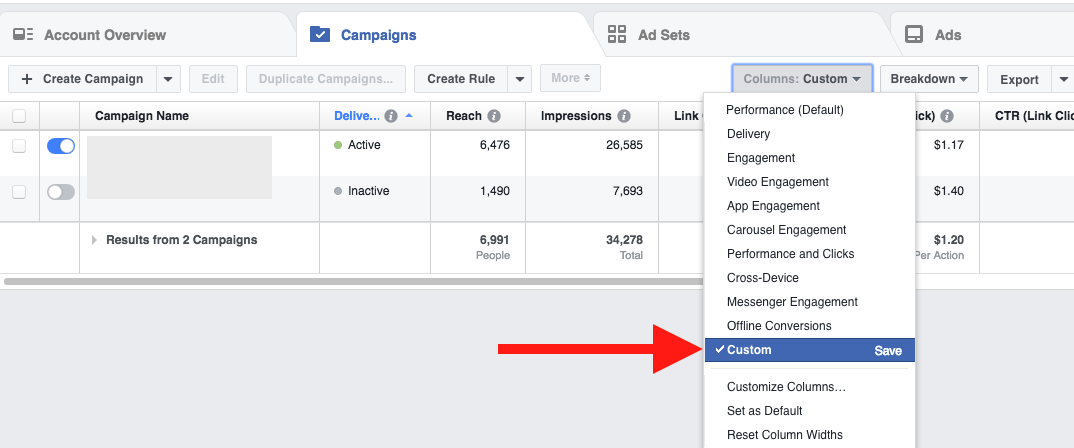
As an easy way to preserve your favorite metrics in the Ads Manager interface, use the Columns dropdown to save a custom set of columns. You can then easily access these whenever needed.
The goal of reporting is not necessarily to overwhelm clients with every possible metric, but rather to highlight the most important metrics for a particular client and campaign. When weeding through the array of metrics available in Facebook, make sure you narrow your reporting to the key numbers that prove the success of a campaign. You’ll often find this revolves around showing how many people saw, clicked and converted to leads from ads. Facebook is a powerful tool for building awareness and a customer base. By monitoring and reporting on the right metrics, it will be easier to prove the value of your Facebook initiatives and your expert guidance to clients and internal teams.

