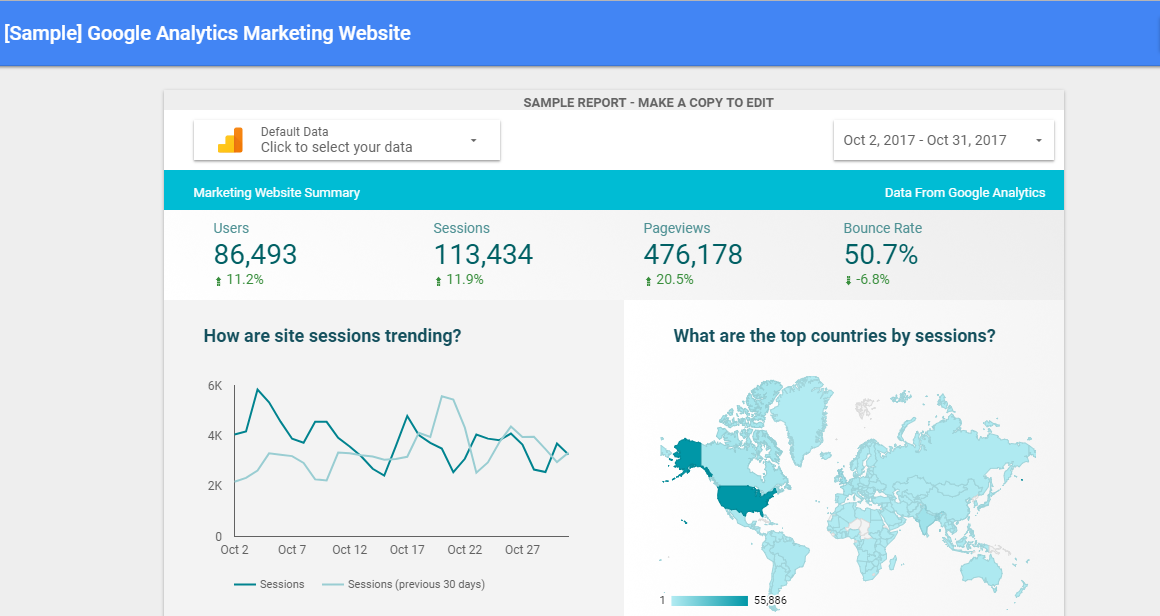
What is Google Data Studio?
What is Google Data Studio (GDS) exactly? GDS is a data visualization (or business intelligence) tool like Tableau or Microsoft Power BI. Although not as powerful as Tableau, it is designed to be user-friendly and easy to integrate with Google data sources like Google Analytics, Google Sheets, Google AdWords, and YouTube. With GDS, users can drag and drop data from these sources onto a canvas to build custom, shareable reports. Google bills the product as a dashboard, but its free-flowing, customizable nature makes it very different from the standard Google Analytics dashboards we are used to.
What is Megalytic?
Megalytic, on the other hand, is a productivity tool for digital marketers - designed to provide data visualization, but also to manage the process of creating, updating, scheduling, and distributing marketing reports. Megalytic has built-in templates and widgets designed to meet the most common digital marketing reporting needs. It has scheduling, automated data refresh, and mailing list distribution features for managing the reporting workload. Also, Megalytic is designed around the concept of a multi-paged report. Every report you create in Megalytic can be rendered to a Letter or A4 multi-paged version. Both landscape and portrait views are supported.
If you need to build out a few reports for an upcoming marketing meeting or special project, GDS may be a good choice. However, if you need to manage a portfolio of marketing reports that are sent out monthly (or weekly) and are evolving and improving over time, then Megalytic is probably a better choice.
How Does GDS Work?
Google Data Studio works by taking raw data and funneling it through a visualization software that gives you fine-grained control over the dimensions and metrics being displayed. You can create highly customized visualizations, but to get the most out of this level of control, you will need to be familiar with the underlying data fields available from data sources like Google Analytics, AdWords, etc.
Once you have chosen the data you want to show or analyze, you can use the various creative formats in GDS to organize the data into tables, charts, graphs, and various other visualizations. Once you’ve organized your data, the Style Lab allows you to choose from a variety of color palettes, fonts, font sizes, and other creative elements. There is a series of video tutorials available to help master the intricacies of building and formatting your visualizations.
Similarities Between Google Data Studio and Megalytic
While each platform is different in terms of layout and user interface, both support custom reporting built around data visualization.
Customization Options
One of the key reasons marketers use platforms like GDS or Megalytic is that reports are very fluid. You can choose which data to include and how to display it visually as graphs, tables or charts. Both reporting tools allow you to create custom headlines and notes, and you can prioritize certain data points by giving the elements uniform styles.
Multiple Sources of Data
Also, both platforms allow you to connect to a variety of data sources including Google Analytics, Search Console and AdWords. They also both have the option of including images, text fields and the opportunity to pull in data from Google Sheets (Megalytic also supports Dropbox).
Visualized Data
GDS and Megalytic are both platforms that make data more visual than spreadsheets and more uniform than a standard Google Analytics dashboard. The goal of each is to help make insights easier to ascertain in analysis and results clearer for clients. From a creative standpoint, they both offer various themes that can be tailored for your brand or your clients.
The overarching similarity of GDS and Megalytic is the ability to customize, coordinate and organize data in a way that is more succinct and focused in order to make reports more meaningful to internal teams or clients than traditional analytics interfaces. Both tools are intended to help marketers save time and increase efficiency in terms of the aggregation and assembly of reports.
What Are the Differences?
Of course, there are some differences between GDS and Megalytic that influence the data input, report output and overall user experience.
Facebook and YouTube
In terms of automatically connected data sources, there is one notable channel distinction. GDS has integrated YouTube analytics while Megalytic has Facebook Insights. If you are using GDS you can import Facebook data using a spreadsheet or community connectors, but at the time of this article, there is no Google supported integration that will auto-populate tables and graphs with Facebook data.
Megalytic does have widgets to automatically incorporate Facebook Pages data and Facebook Ads data into reports without using external input. This integration pulls data directly from your connected Facebook account or accounts and automatically populates tables, charts and graphs with information like page likes, reach and impressions. Widgets also include posts published and Multi KPI options for timeframe based performance comparisons.
Data Sources by Account
In line with data integrations, one of the other differences is the ability to source data across multiple Google Analytics (GA) accounts. In GDS using your GA account, you can include any data source and view the properties that account has access to. But in order to create the dashboard, the account you’re using must have access to all the necessary data sources.
However, if you’re in an agency setting and you are using multiple accounts for clients, then you will have to log into each account separately and create your GDS reports in the account corresponding to the profile whose data you need. Within Megalytic, once your connections are verified you can choose any GA profile from any account you have access to and build, without logging into or out of multiple accounts. This functionality contributes to increased efficiency and centralizes the reporting process.
Data Delivery
One of the other differences relates to your presentation options. GDS is an online-only tool, which makes for interesting interactivity but a lack of portability. As it can only be accessed online, it must also be presented digitally. This makes it difficult (nearly impossible) to share a PDF version of a report or print handouts for your big meeting. In Megalytic, there are options to print and download each report as a PDF.
In fact, Megalytic reports are designed to be viewed either as a single, scrolling, web page (called "web-view mode") or as a multi-page document (called "print-view mode"). When converting from web-view to print-view, page breaks are automatically inserted, long scrolling tables are split neatly across pages, and charts/images are moved so as not to fall across page boundaries.
Both GSD and Megalytic reports can be shared as an email or a link, but Megalytic also offers a “Schedule” option. Scheduling a delivery allows you to complete a report and set the time of delivery with a personalized message for a later time. You can also schedule them to be delivered daily, weekly or monthly, allowing you to focus on the information and automate the delivery.
Ease of Use
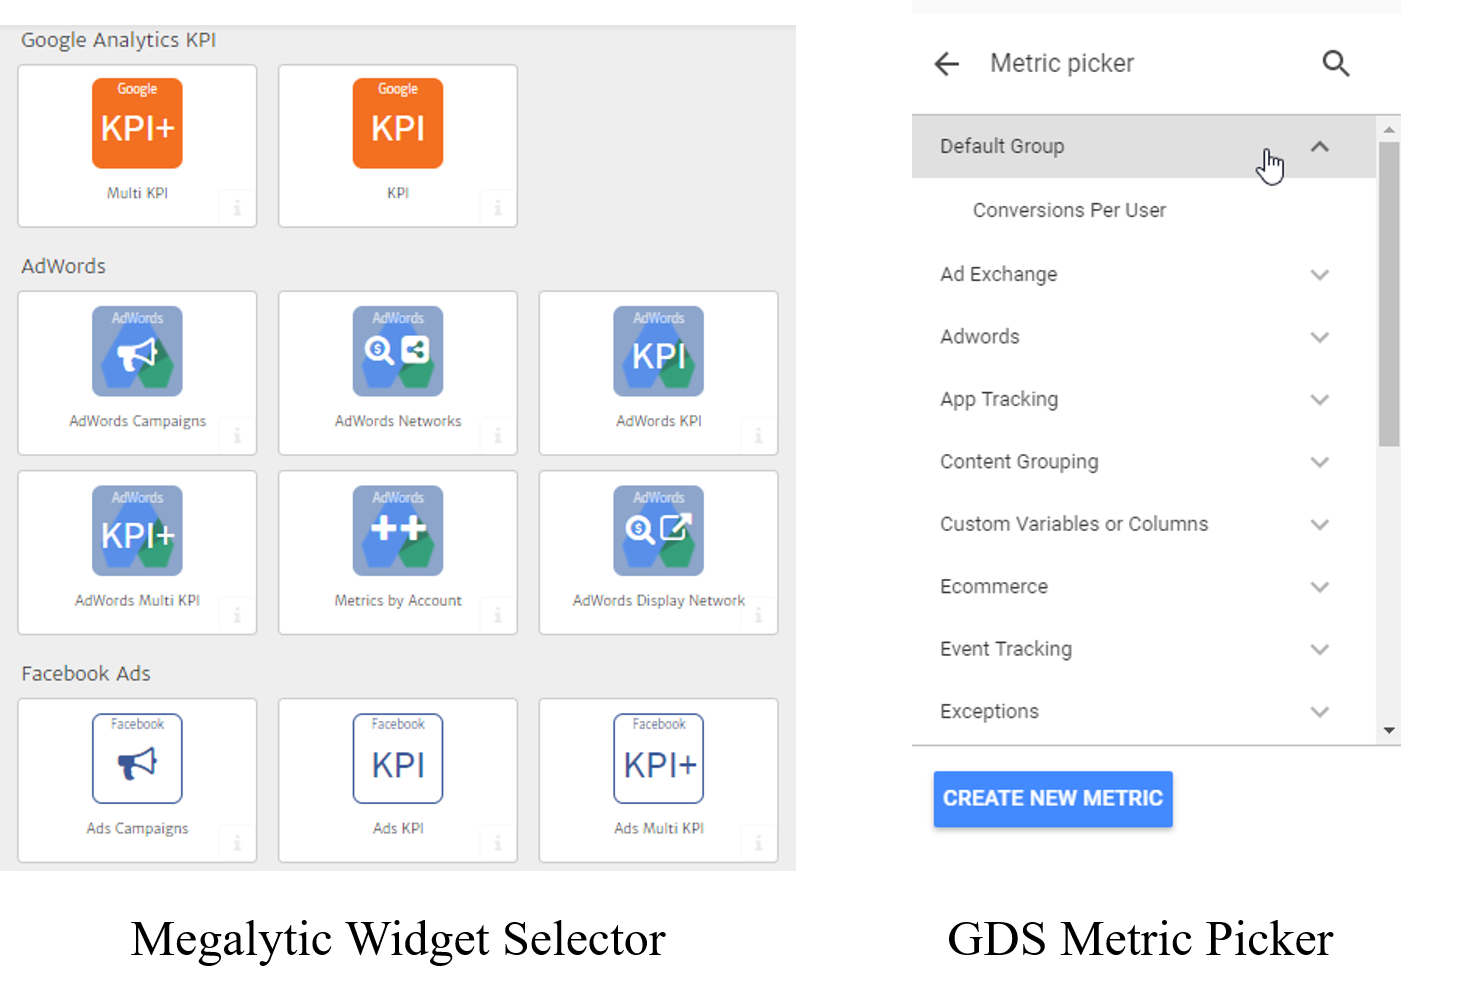
Let’s start with the caveat that as far as these things go, GDS is pretty user-friendly. It has a free-flowing, drag-and-drop interface and data selection system that, once you get used to it, is pretty simple to use.
However, one of the more challenging aspects of report building, in general, is that creating the right aesthetic can be harder for those who don’t have an eye for design. For those who struggle with creating slick visuals, the freedom allotted in GDS can be a bit overwhelming. There are templates to build from, but once you step outside a template in terms of layout and information flow, you may find yourself a bit adrift. The blank slate situation means there is more of an upfront investment of time and effort in creating the reports you want.
Megalytic has a more streamlined operation in terms of layout, allowing for a very quick learning curve before you are proficient in creating clean, organized presentations. The drag-and-drop widget methodology is also more intuitive with fewer initial choices for data display and with deeper customizations by segments and dimensions within the widgets themselves.
Say Hello
Finally, Megalytic is no Google. While we’d all like to have Alphabet’s bottom line, they are called a juggernaut because they are huge. Here at Megalytic, we like to think we’re a little more accessible. Reporting is what we do, and our developers are constantly taking action based on the feedback from our clients. It’s our user insights that have led to a number of our more popular features and customization options. We’re currently working toward integrating new data sources including Bing, Twitter, YouTube, MailChimp, etc. So if you are a user or even just experimenting with our free trial we want to hear your thoughts.
Conclusion
Every marketer’s reporting needs are different. So are each marketer’s time constraints and design skills. That’s why everyone has their own personal preferences and wishlist items when it comes to reporting tools. But as far as GDS and Megalytic, they have a lot in common but also have differences that range from small to significant. No amount of analysis on the two tools though can give you the sense of what it’s like to use either or both. The only way to get a sense of what works for you is through experience, so get in there and start experimenting. Happy reporting!

