What is Google Search Console?
Google Search Console (GSC) is a free service that lets you monitor how well your web site’s content is performing in Google Search. Some of the important SEO information you can learn from Search Console includes:
- Which queries (i.e., keywords) direct the most Google search traffic to your site.
- Which pages on your site receive the most Google search traffic.
- For any given page, which queries are sending the most traffic from Google search to that page.
- Which content from your site has Google indexed. (Or are any of your pages inaccessible to Google search.)
- Errors that Google may have found while crawling your site (e.g., broken links or 404 errors).
- Security issues that Google may have detected with your site's content.
- Other domains that are linking to your site.
- Mobile device usability issues found with your content.
- and much more ...
The first three of these items are the main focus of this post. These provide the primary data needed for SEO benchmarking and monitoring.
While Google Search Console has information that’s useful for anyone who has a website, you’ll find that many clients do not understand (or they are overwhelmed by) all the data it can offer. This is a great example of how you can add value for your clients through client reporting. Explaining this data clearly is an opportunity for your agency. You can present this data to your client, interpret it, and make SEO recommendations based on your interpretation of the data. One of the best uses of this data is for creating an SEO baseline.
But there is a lot of data available in Google Search Console. How do you know what’s important to share with your client? In general, you should report back to them the data that you used to make your SEO recommendations. Involve them in the decision-making process. Invite them to be your partner.
Each client will have different data needs, based on their Google Search objectives. However, there are some fundamental metrics from GSC that you should share with all your clients. Let’s start by looking at how to set up and share access to Google Search Console.
Google Search Console Setup and Sharing Access
Initially, your client's website may not even be set up for GSC. So, your first step is to help them get set up. Follow Google's instructions here. For the site verification step in the setup process, we find that the HTML file upload method is often the easiest and most straightforward.
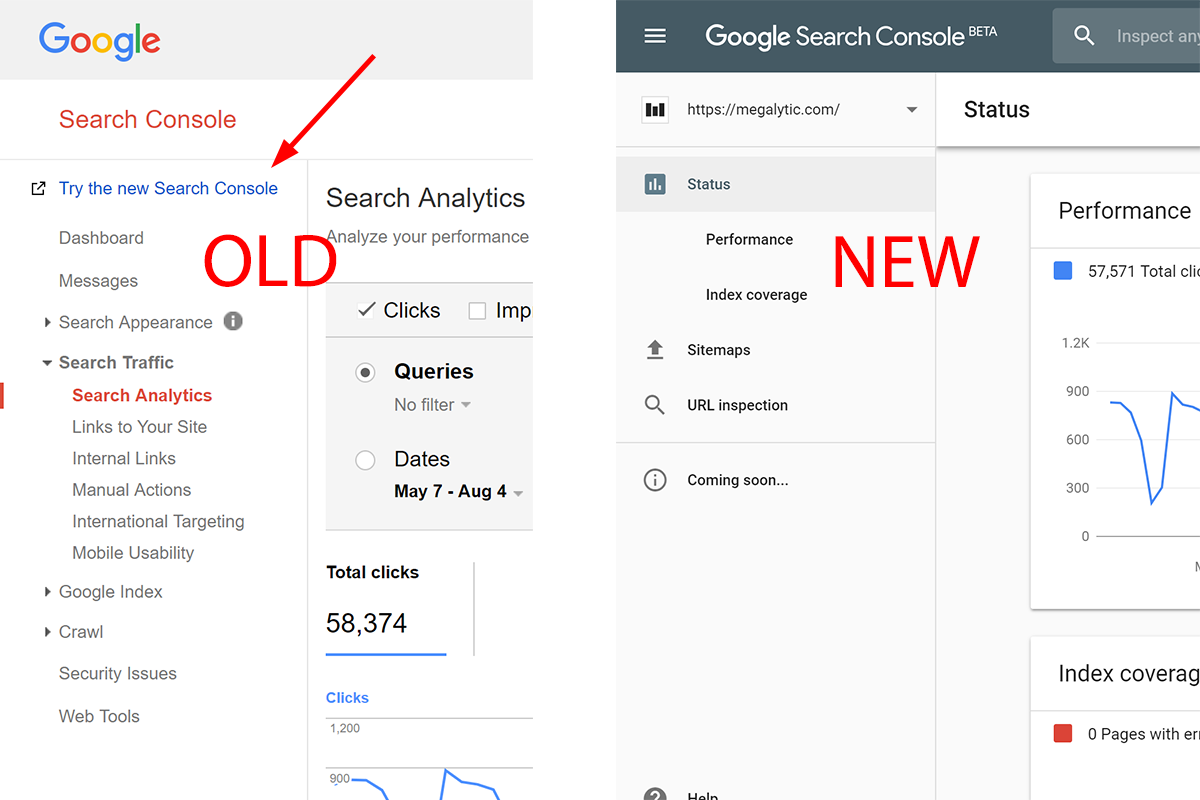
After your client has set up GSC for their website, they should share access with you (as the agency). Google provides detailed instructions under Managing users, owners, and permissions. When you log in, you may initially see the old version of the GSC product, but you are going to want to switch to the new version by clicking on “Try the new Search Console”. Beside having a better UI, the new version gives you access to up to 16 months of data (vs 90 days in the old version).
Once you have access, go through their data in GSC and identify what is important to share with them as a baseline, and in your ongoing reporting. Here are some pointers to help you understand what's most important.
Search Analytics
Search Analytics is the most important data category to share with clients. Most clients will want to understand how their website performs in organic searches. This section has that information. The Search Analytics section provides insight into a website’s overall Google Search performance using four metrics: Clicks, Impressions, CTR, and Position.
Clicks simply refers to the number of clicks from a Google search results page to a website’s pages or images (for an image search). Clicks can come from Web searches, Image searches, or Video searches. All three can be viewed in GSC, but the Web searches data is shown by default.
Impressions refers to the number of times that your website content has appeared in Google search results and could have been seen by a searcher. We say ‘could’ because Google can’t say for certain if someone saw a result. Google counts an impression if the user was on the page on which the link appeared. For example, if the user was on page 2 of the search results and the link to your website showed up on page 3, this would not be counted as an impression.
CTR, or click-through rate, is calculated as the ratio of clicks to impressions (i.e., clicks divided by impressions). This metric tells you the percentage of visitors you got out of the total number who could have seen your content in a Google search. So, if you had 1,000 impressions and 250 clicks, that is a 25 percent click-through rate. While this number implies that your website is missing out on 75 percent of the potential clicks, its important to remember that its impossible to get 100%. 25% may actually be quite good. Typically, the higher your content ranks on the page, the higher your CTR will be. That is because users tend to click on the top results first, and only look lower down if the don’t find the information they need right away.
Position refers to the topmost numeric page rank result from content on your website. For example, if Google returns three pages from your website in response to a query; and those three results have the positions of 3, 4, and 7, your position for that query will be three (topmost). To determine your average position, it takes the average of the topmost positions from each query.
Now that we have a better idea of the metrics that are available in Search Analytics, we are going to see how you use them in different contexts with Google Search Console.
Data for Client SEO Reports
In Google Search Console, you can group the data in various ways and report on these 4 metrics to produce valuable SEO data. Here, we look primarily at the results from grouping by Query or Page.
Keyword (Query) Reporting
The Query option will group all of your data by search query terms (or “query strings”). When discussion SEO, the words “query” and “keyword” are often used interchangeably. The Query grouping only shows queries that returned content from your website search results. You can use this grouping to see if your expected keywords are showing up in the query list. For example, if you want to rank for the keyword “social media marketing” but the query data does not show this keyword, then your website likely does not have enough high-quality content to show up as a relevant result in the Google search results for “social media marketing”.
In order to display the queries for your website, go to Search Traffic > Search Analytics > Queries. To see the most information, select all four metric columns (Clicks, Impressions, CTR, and Position). By default, Clicks is the first column and the data is sorted by Clicks from highest to lowest. This shows you what Google searches (queries) are sending the most traffic to your client’s website.
In the example below, you can see that searches for “Google analytics certification” and “direct traffic” are the queries that send the most traffic (i.e., clicks) to the website. Notice that the position of “Google analytics certification” is 8.3 — near the bottom of the first page. This search term gets a huge amount of Impressions (35,321) compared with the other top queries, so even though it doesn’t have a top position (ranking), it still delivers a lot of visitors.
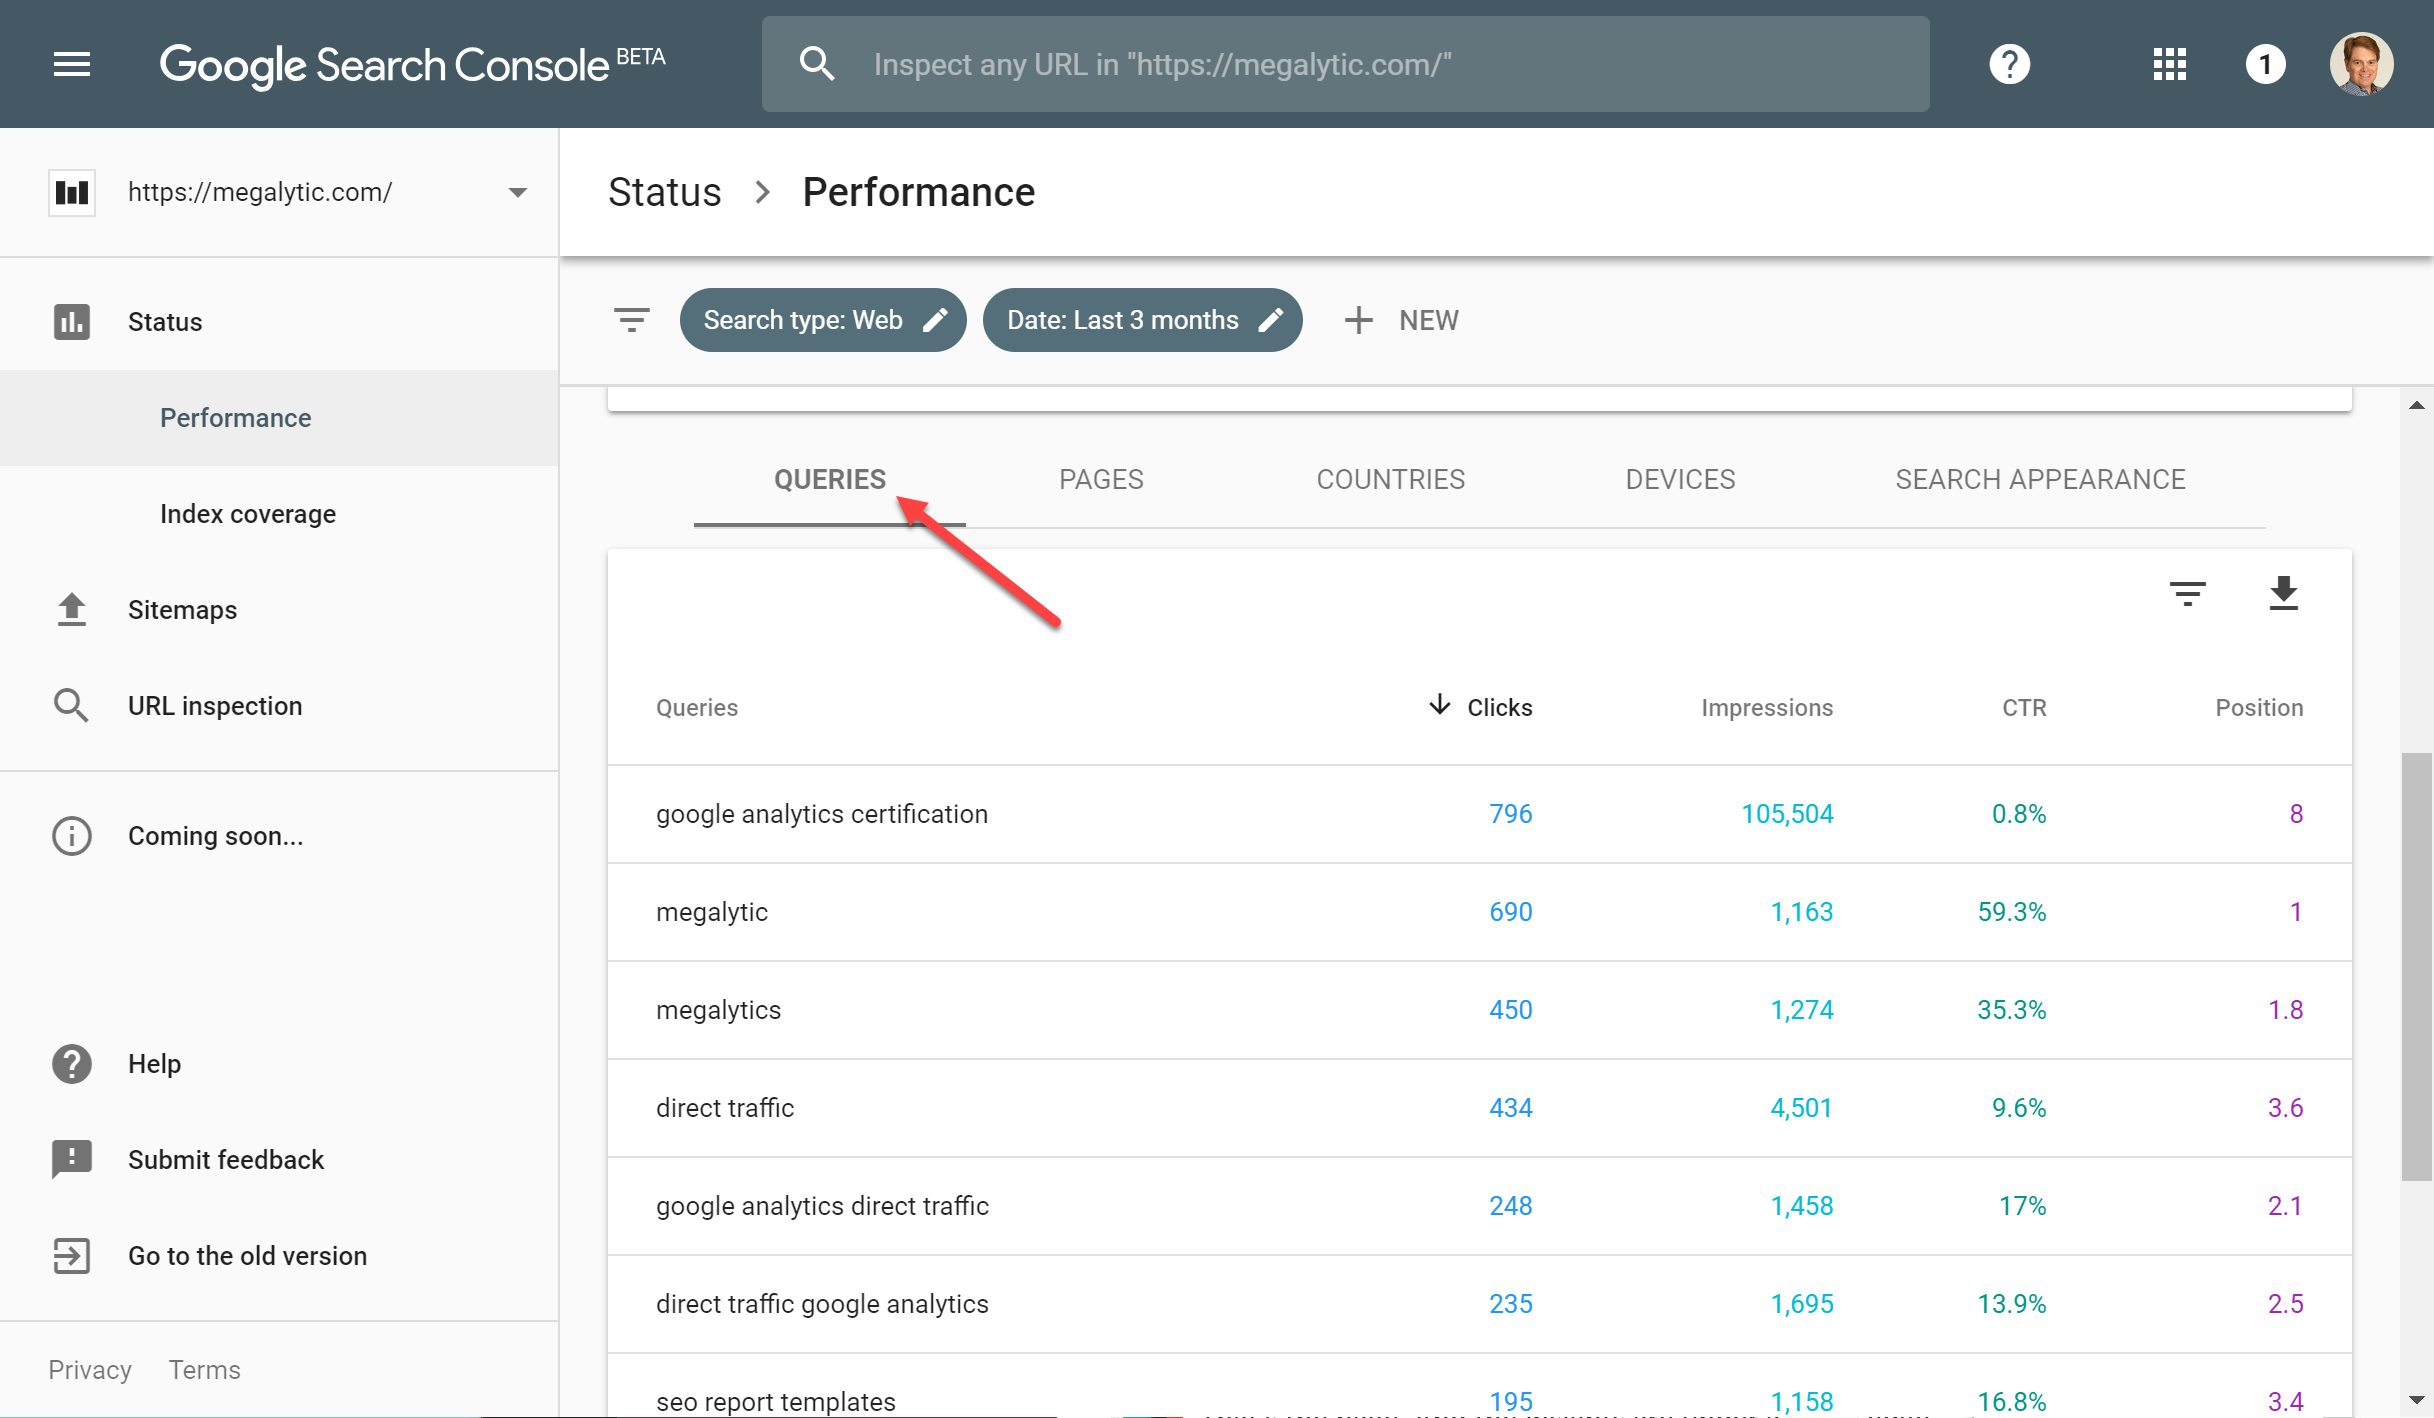
If this query is important to the business, then you can work with the client to create more (or better) content for it and move your website up in the rankings.
Page Reporting
To display the Page traffic from the same website data, click on the Pages radio button. This will show which of the website’s pages get the most traffic from organic Google searches. In the example below, you can see that blog posts are the big search traffic generators for Megalytic.
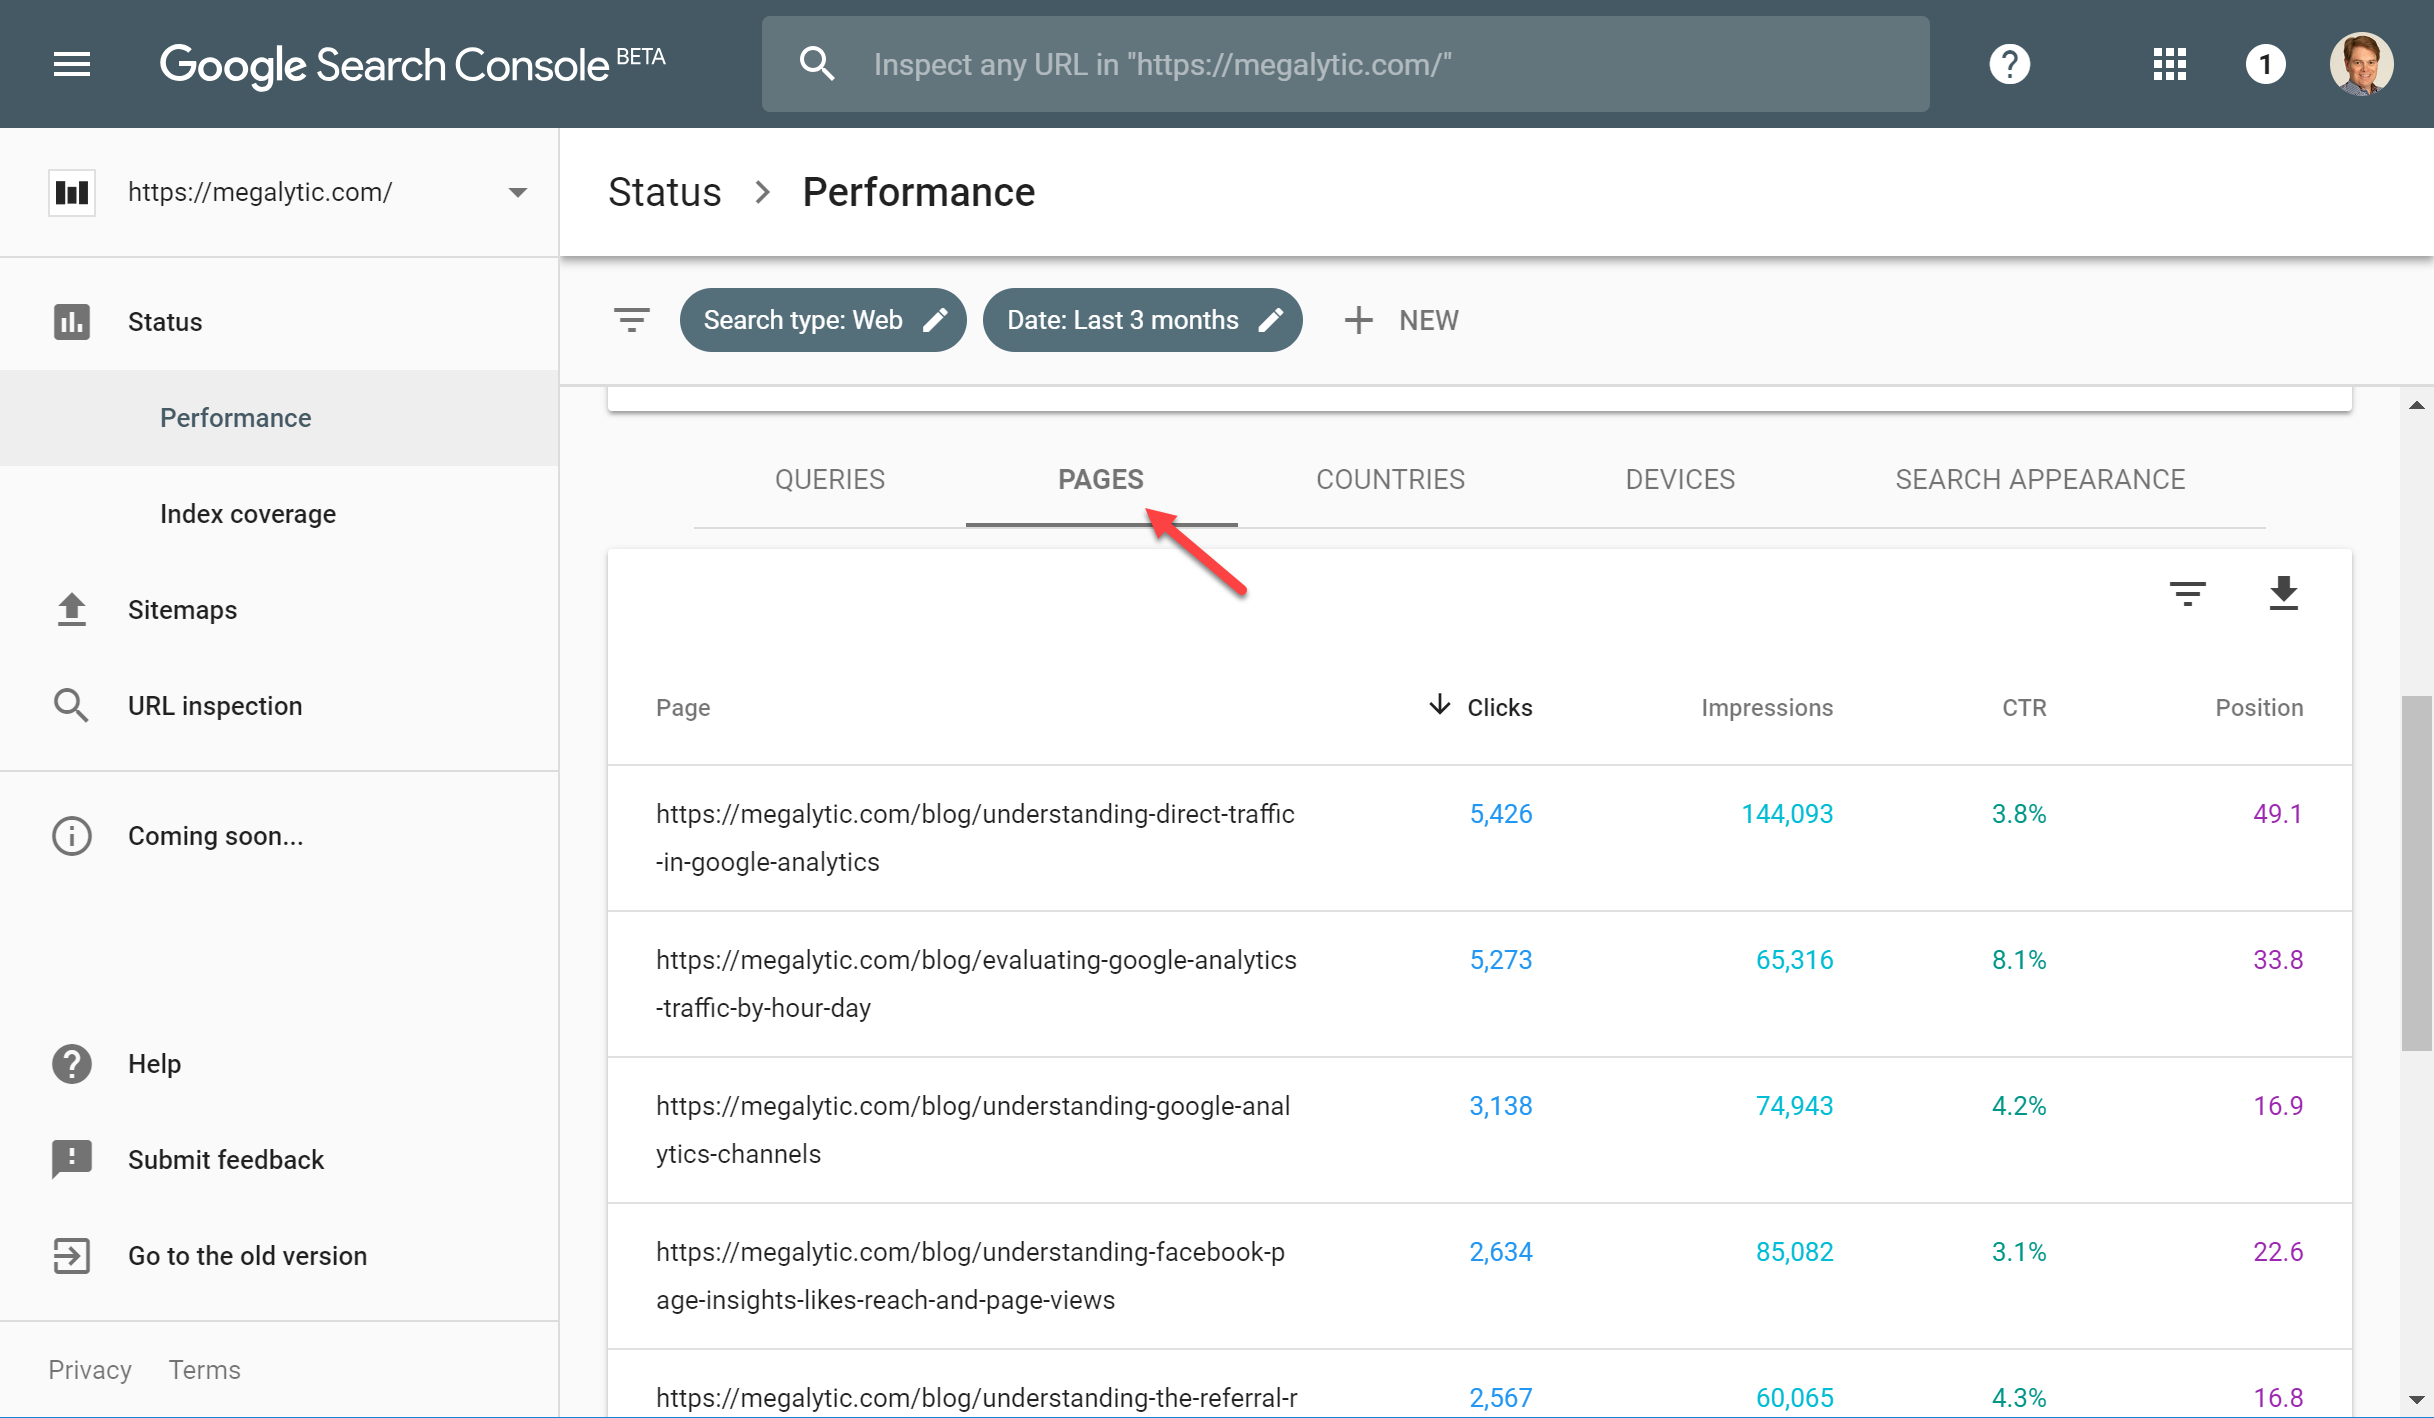
You can use this information to see what types of content are doing the best for your client. Then you can focus on creating more content of this type or quality in order to deliver more organic traffic to the website.
Search Types Filter: Web, Image, Video
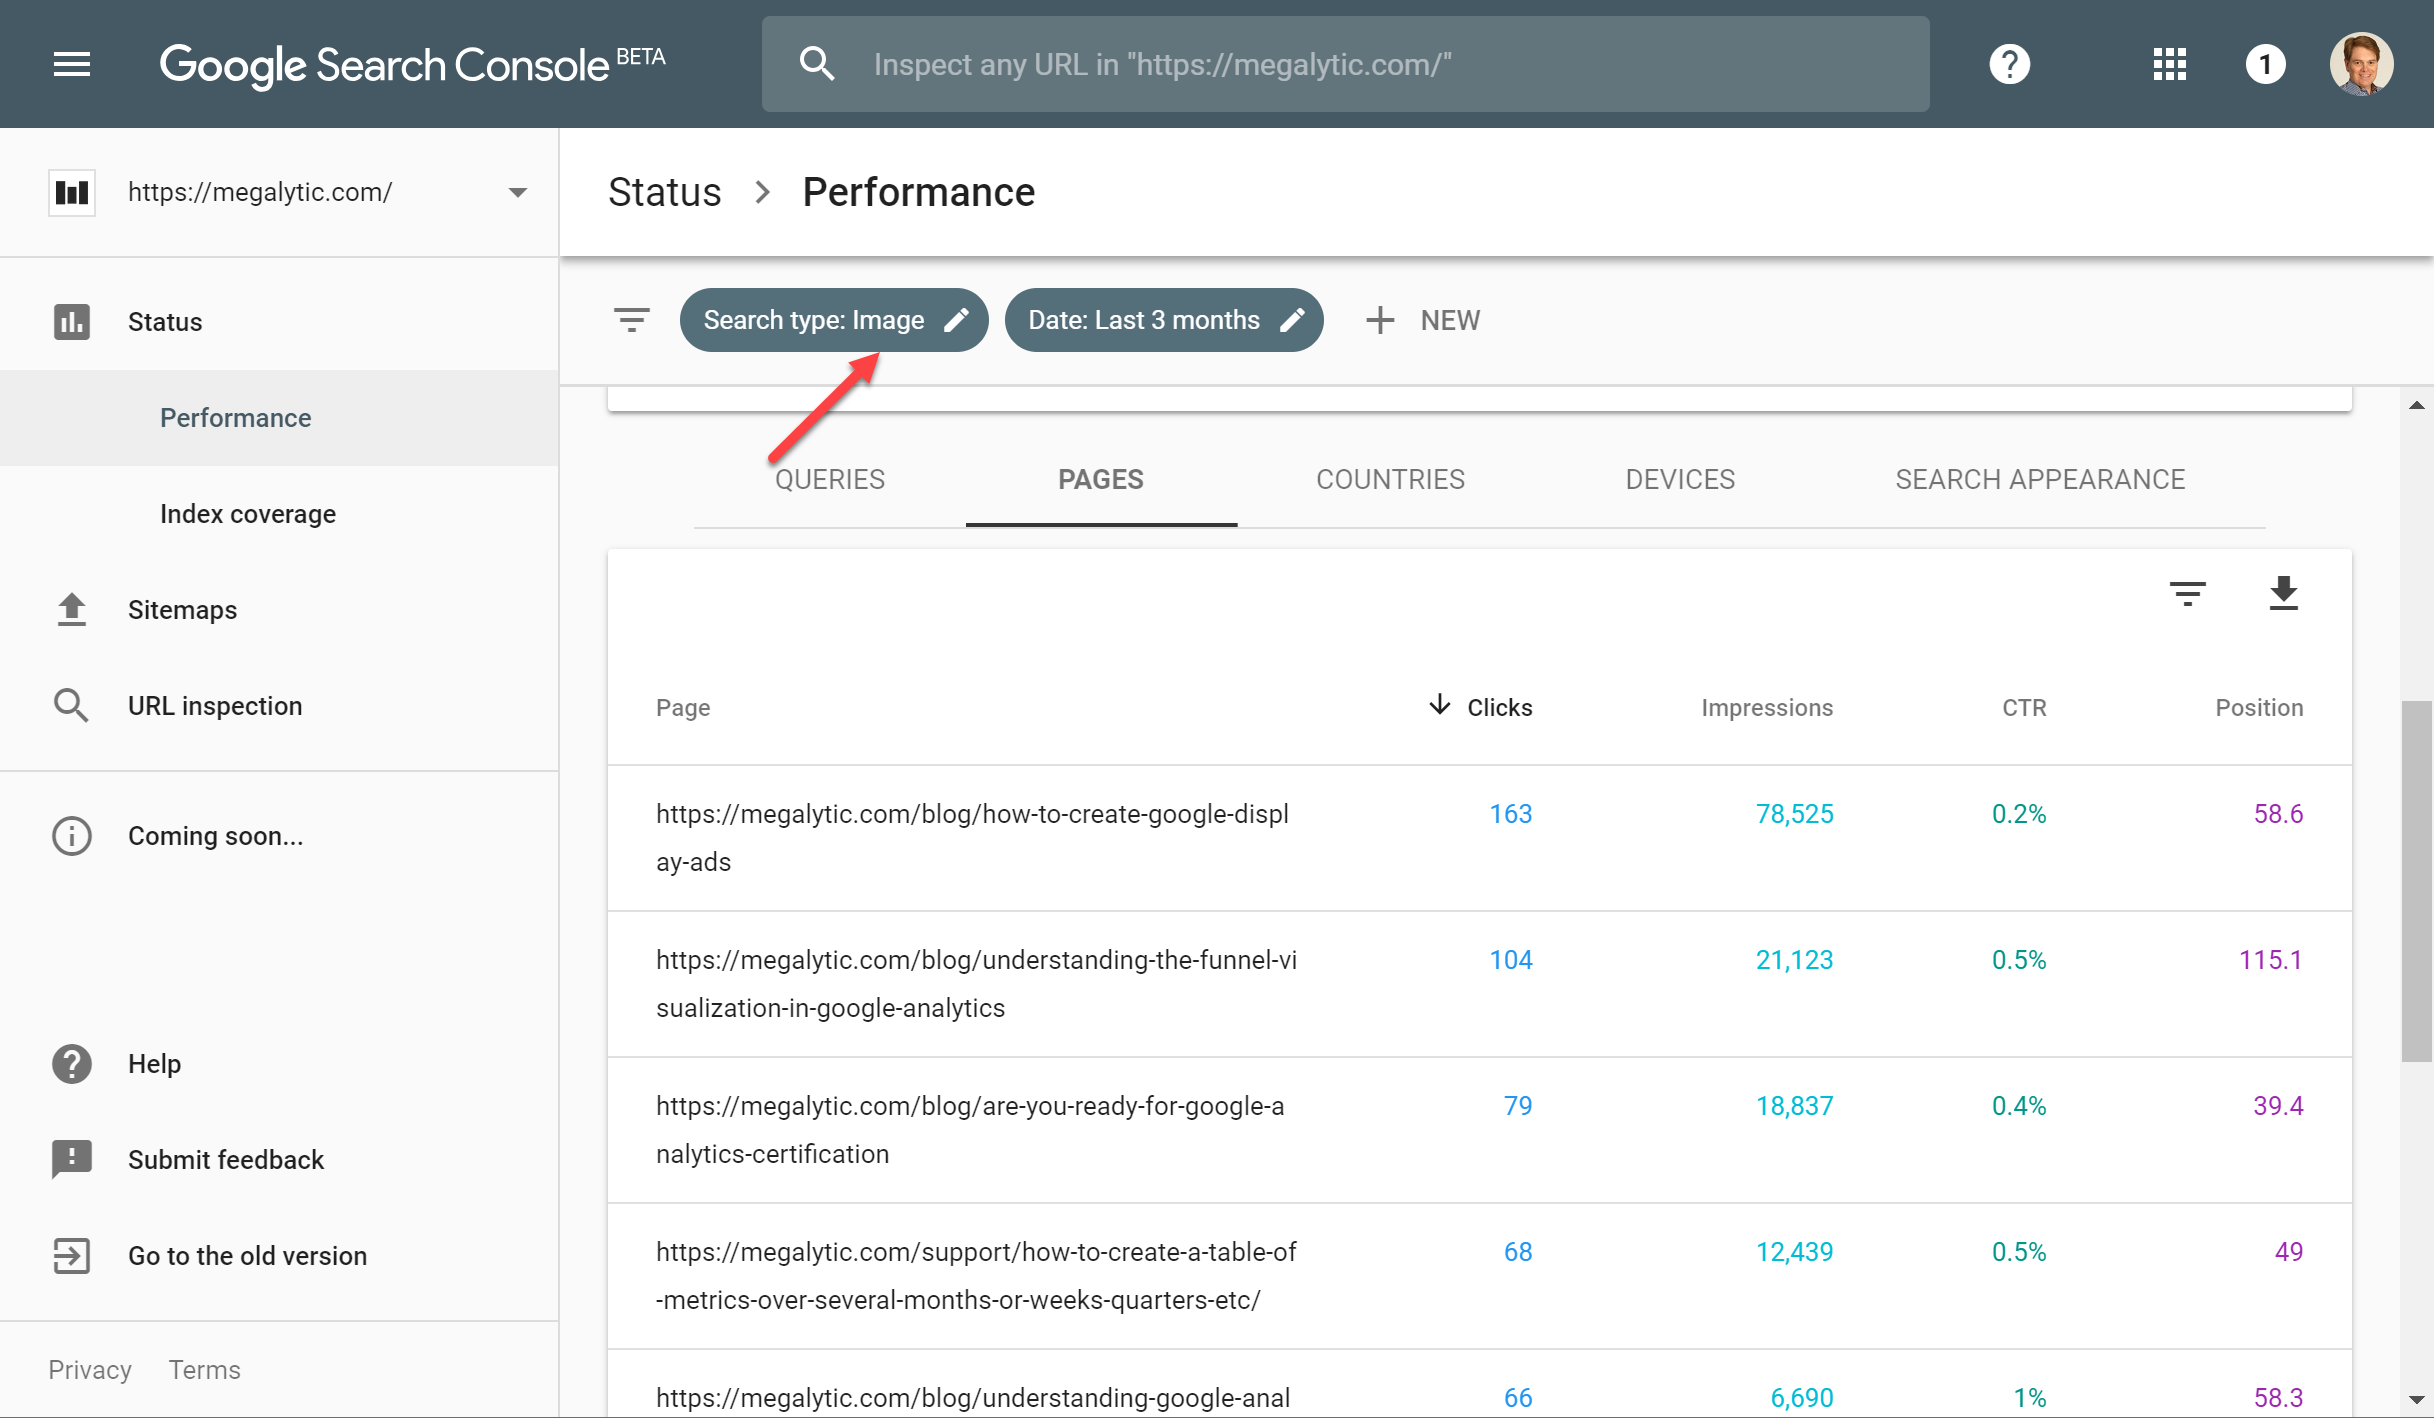
You can filter Query or Page results by Search Type: Web, Image, or Video (note that Web will be the default filter). Change the filter by selecting from the drop-down box under “Search Type.” If you want to show your client how they are doing with Image search, you can filter the results for “Image” and the results will populate the pages that get the most clicks from Image searches. See the example below.
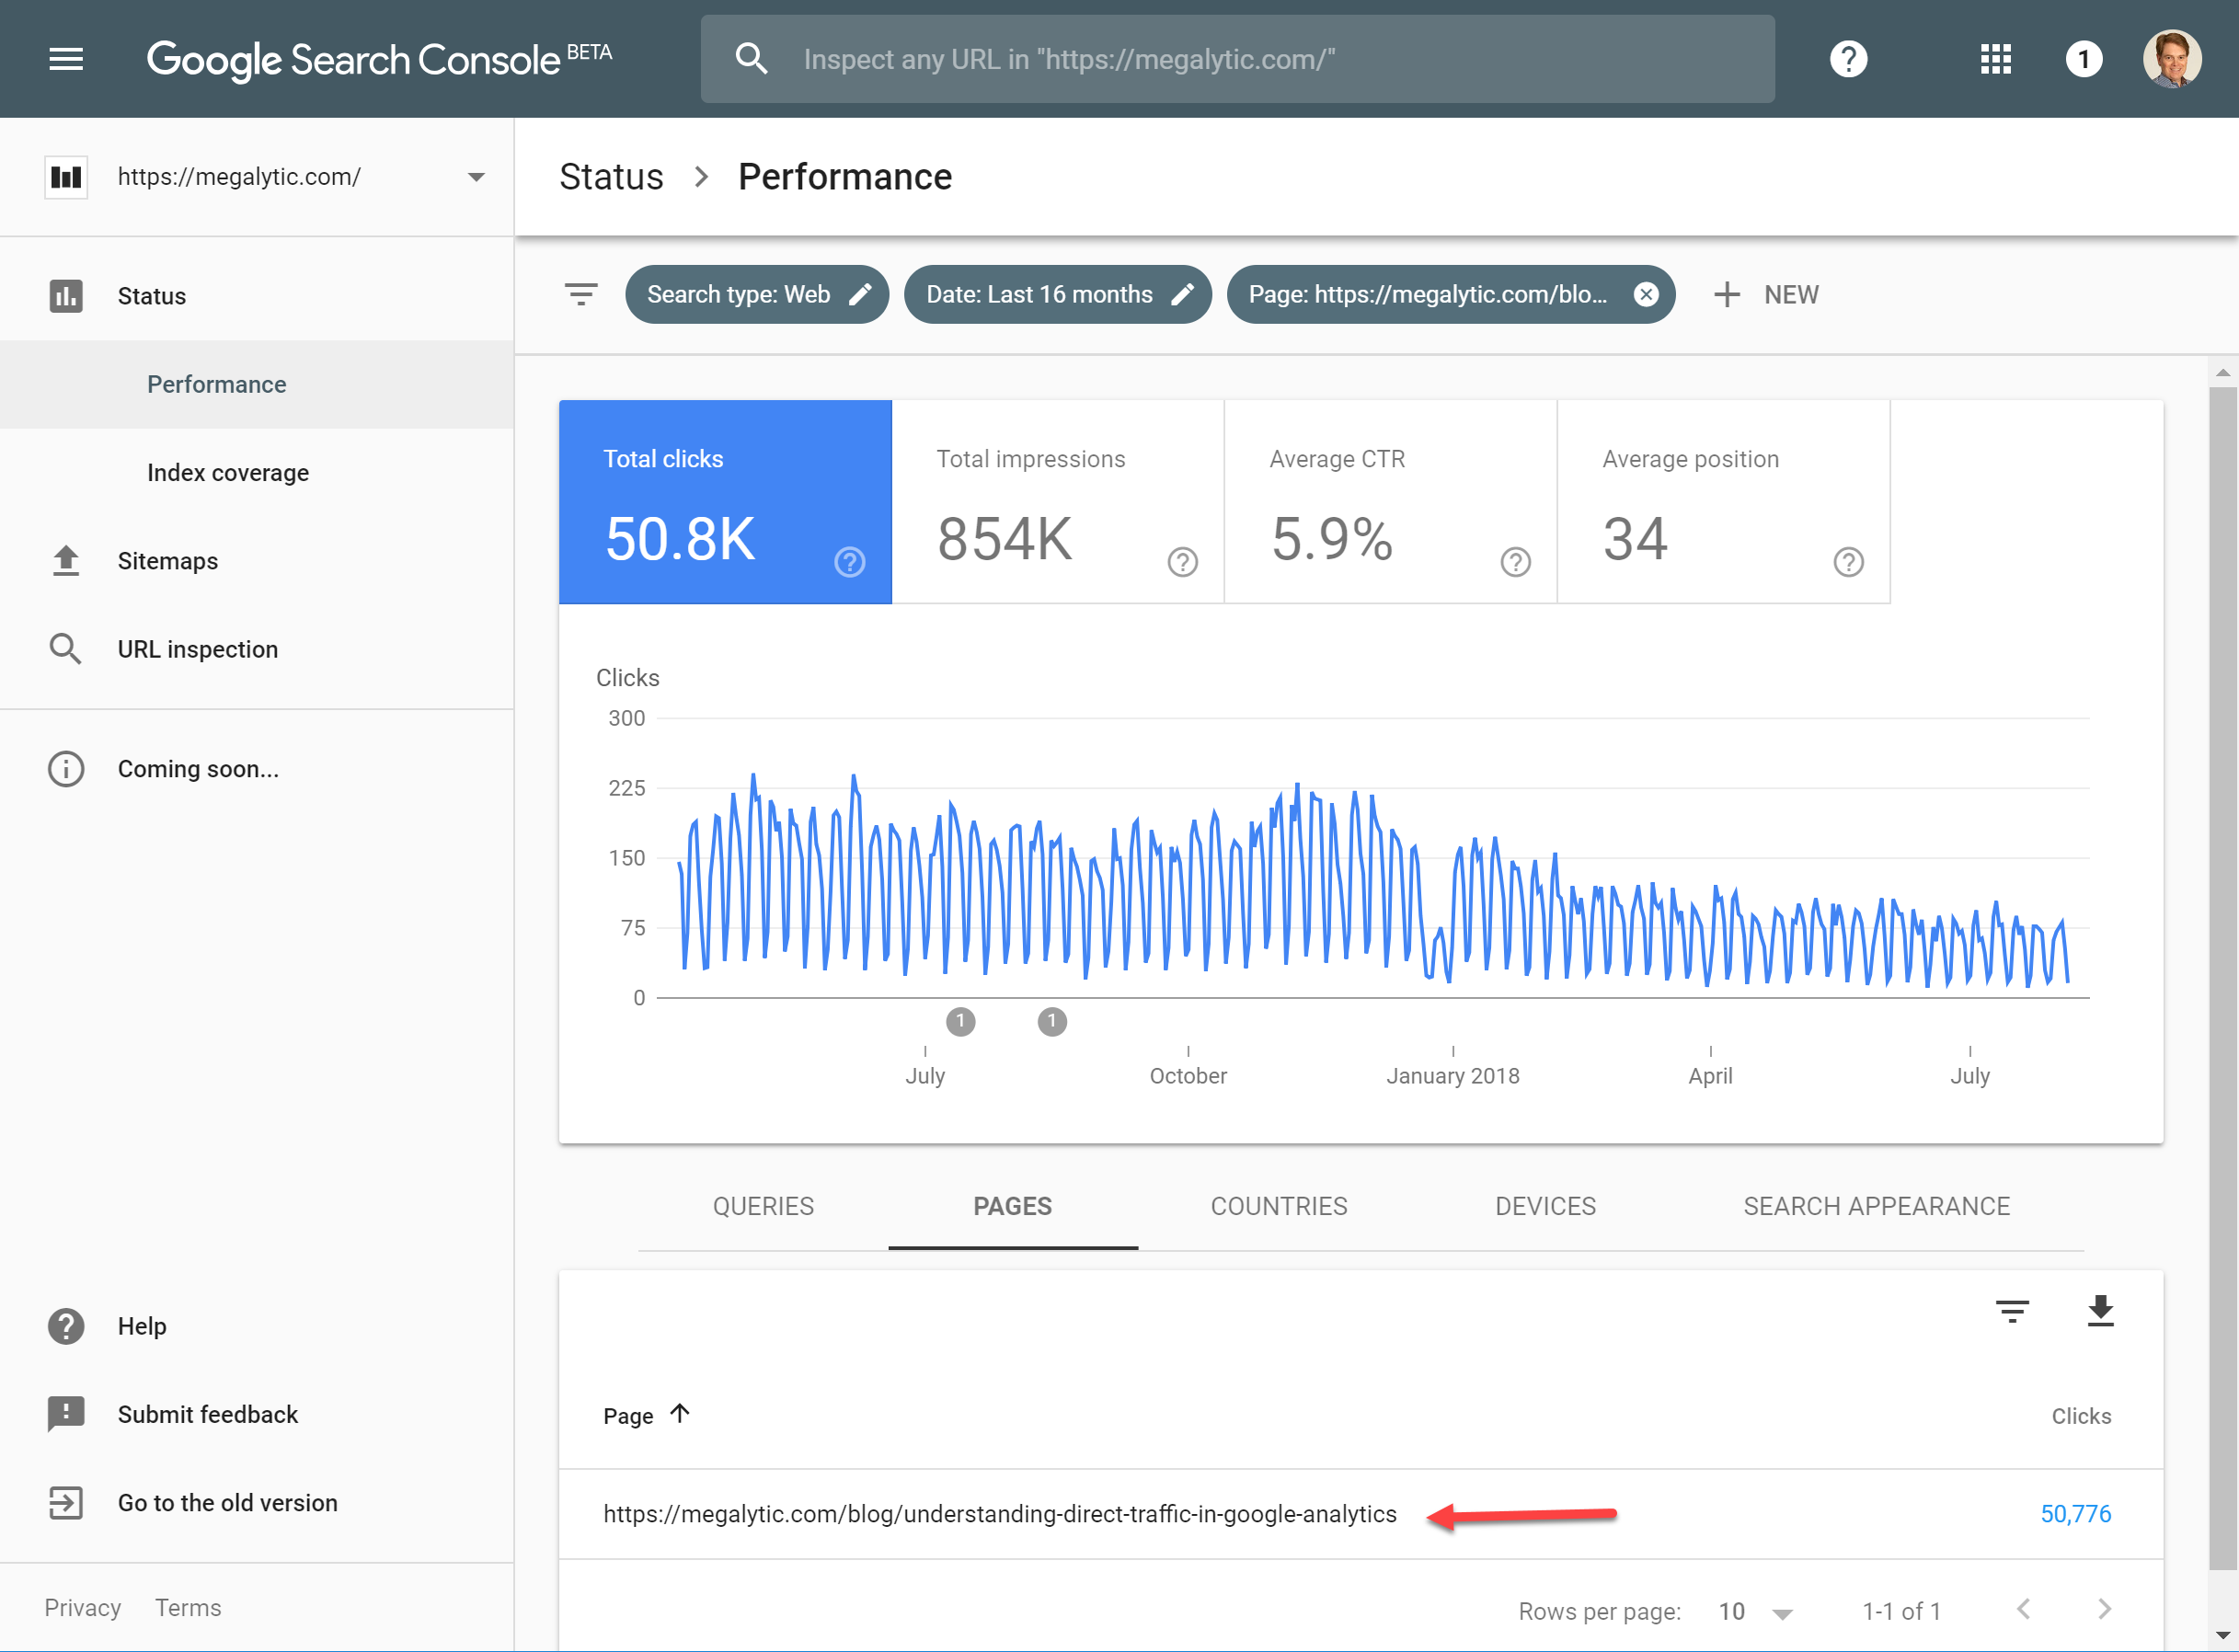
Drill Down to Analyze Specific Content
When looking at pages, you can double click on a single page, and drill down to get data for just that one piece of content. Here, we are looking at the blog post “Understanding Direct Traffic in Google Analytics” and you can see that it was generating 150 - 225 clicks per day last year, but now is averaging about 75 clicks per day. Data like this may inform your client that it's time for the content to be updated. Advise them to edit the post, bringing in new information to keep up with the latest developments, update images to keep up with new UIs, etc.
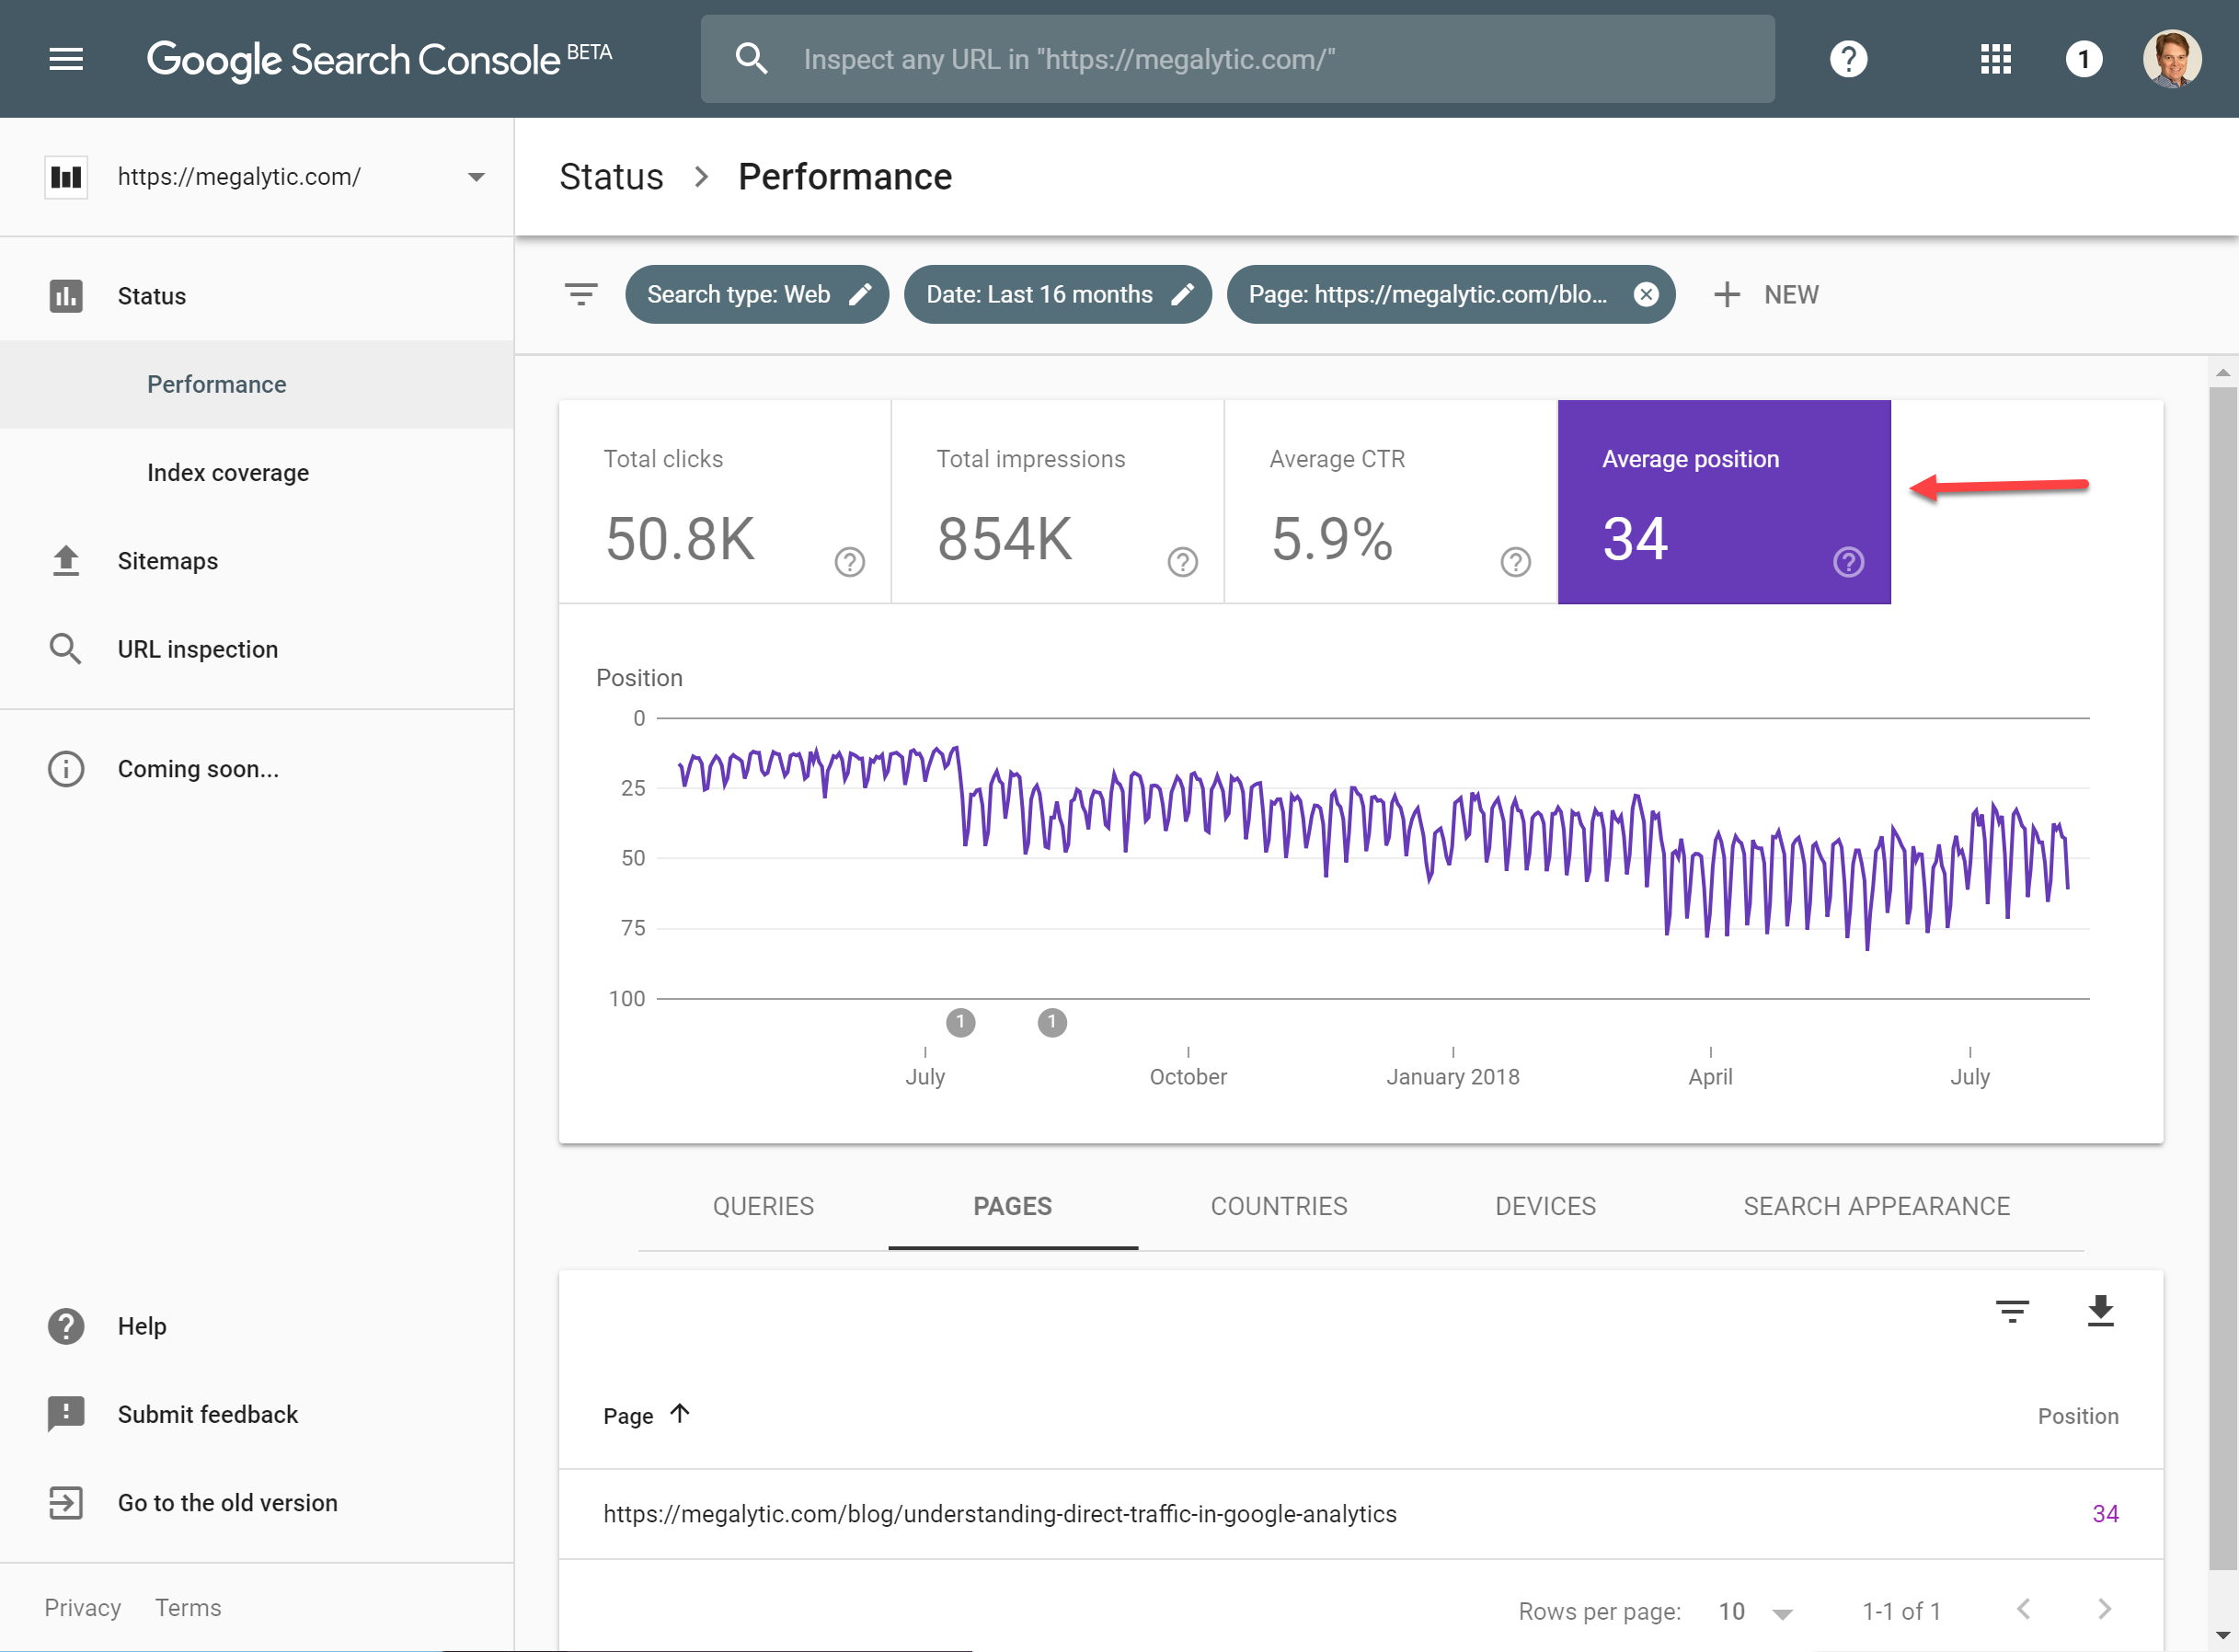
Drill Down to Analyze Specific Content
Continuing with this example, notice that you can switch the metric from “Total clicks” to “Average position”. As you can see, average position where this page appears in search results has slipped from around 12 down to around 40. When you see this happening, you should advise your client to update the post, but also to take a look at content that is outranking them for specific keywords. Finding these competitor pages can be a simple as doing an Google search, or you may want to dig deeper with a tool like SEMRush.
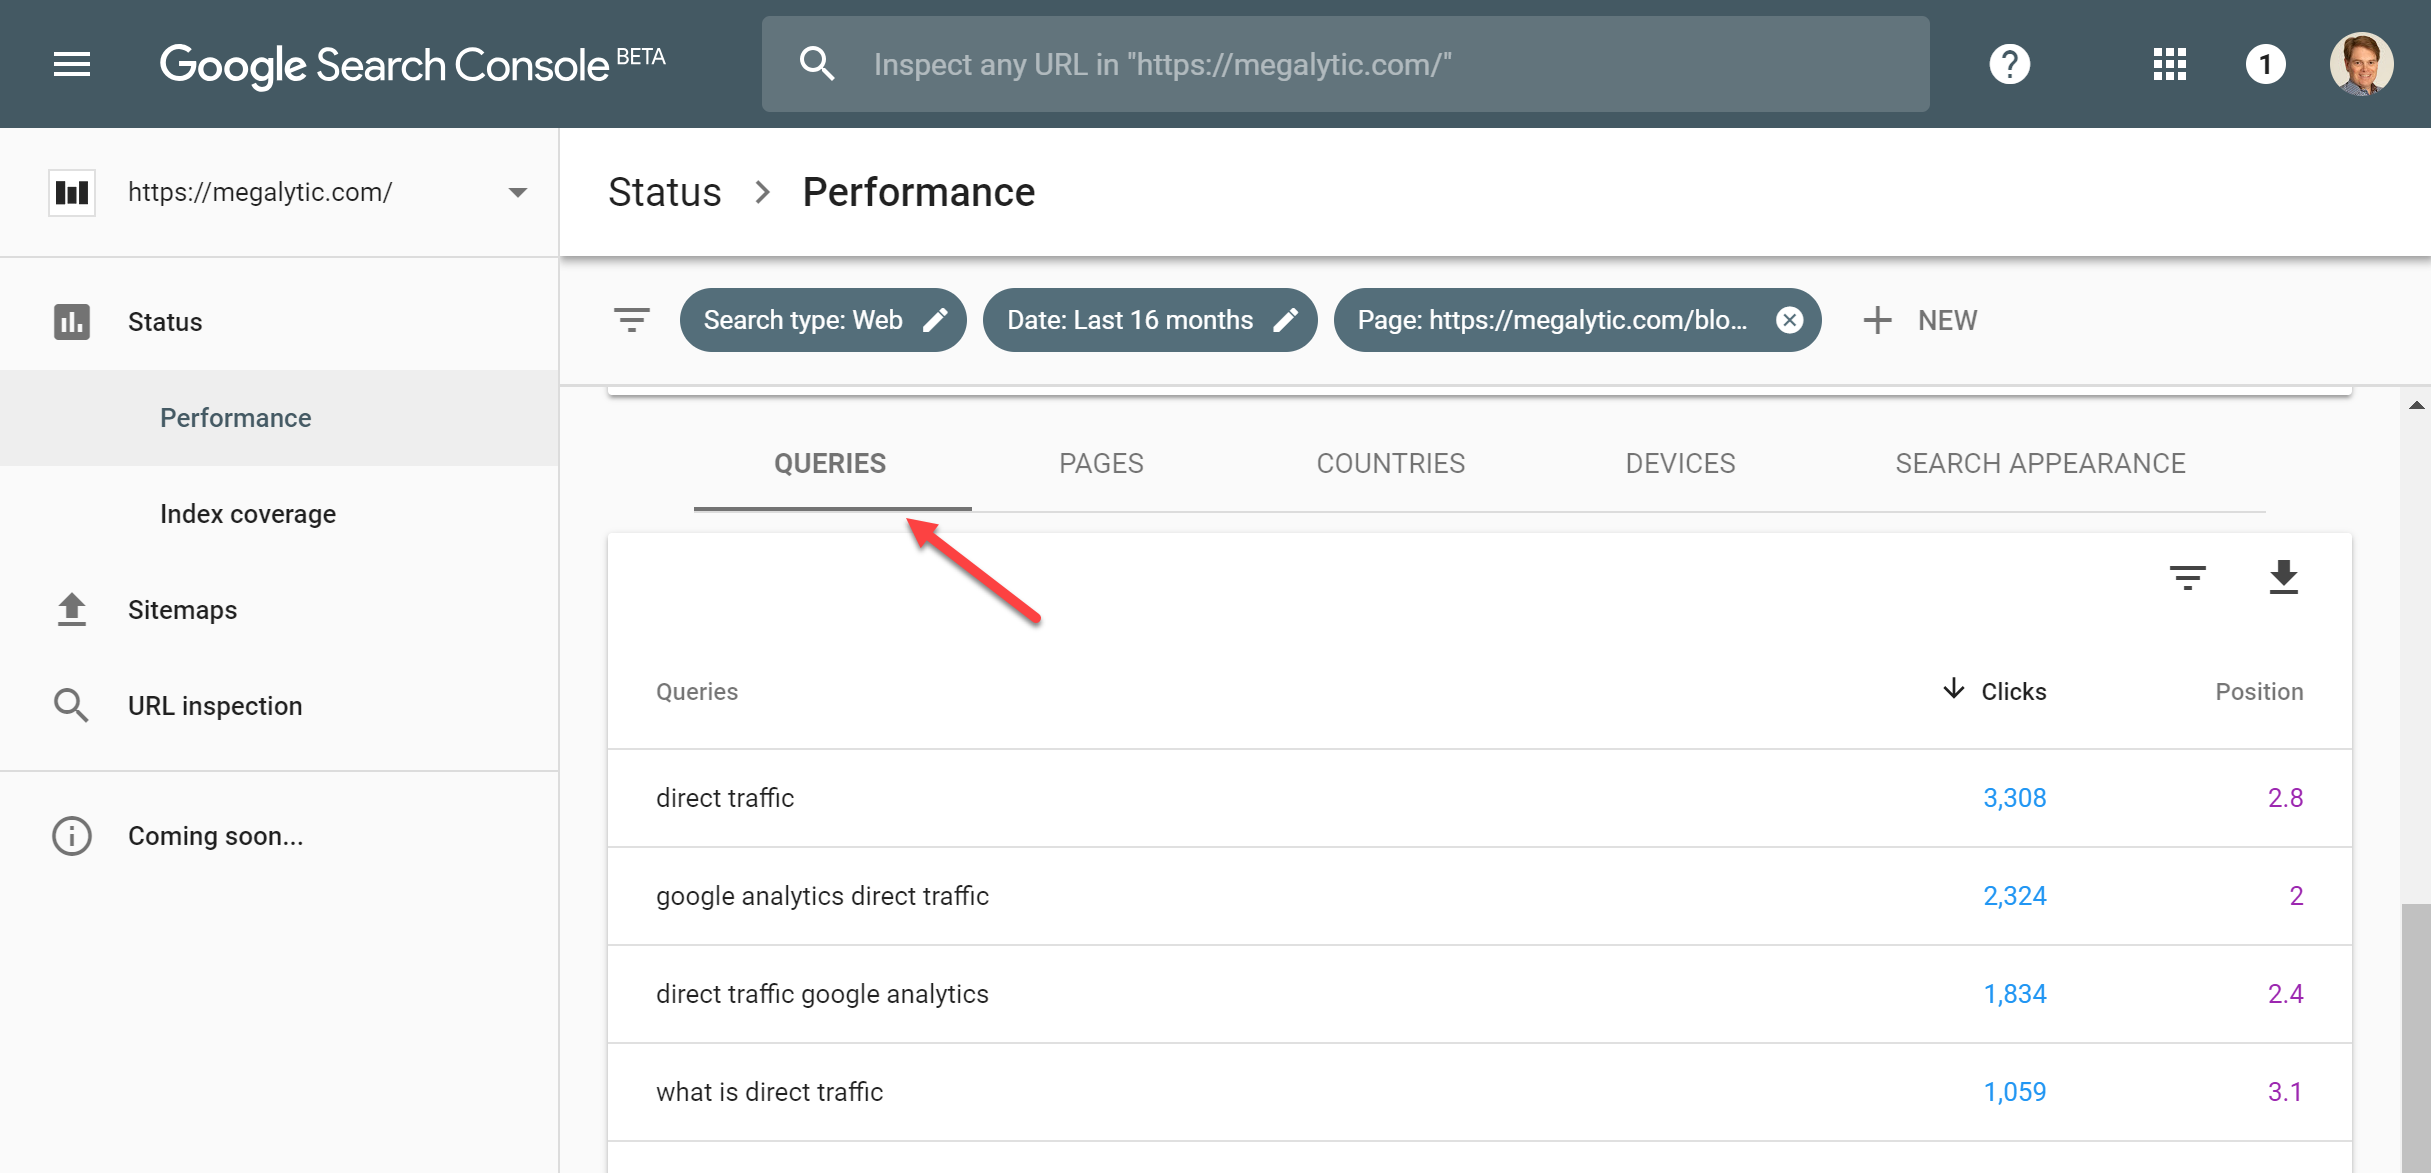
It is important to look at specific queries where your content is getting outranked, because it can be misleading to look at the “Average position” across all queries as shown above. What your client really cares about is how a piece of content performs for specific keywords (or queries). So, sticking with the single page in our example - “Understanding Direct Traffic in Google Analytics”, if you click on the Queries, tab, you can see all the queries that are sending traffic to that page. As you can see, it mostly comes from “direct traffic” and “google analytics direct traffic”.
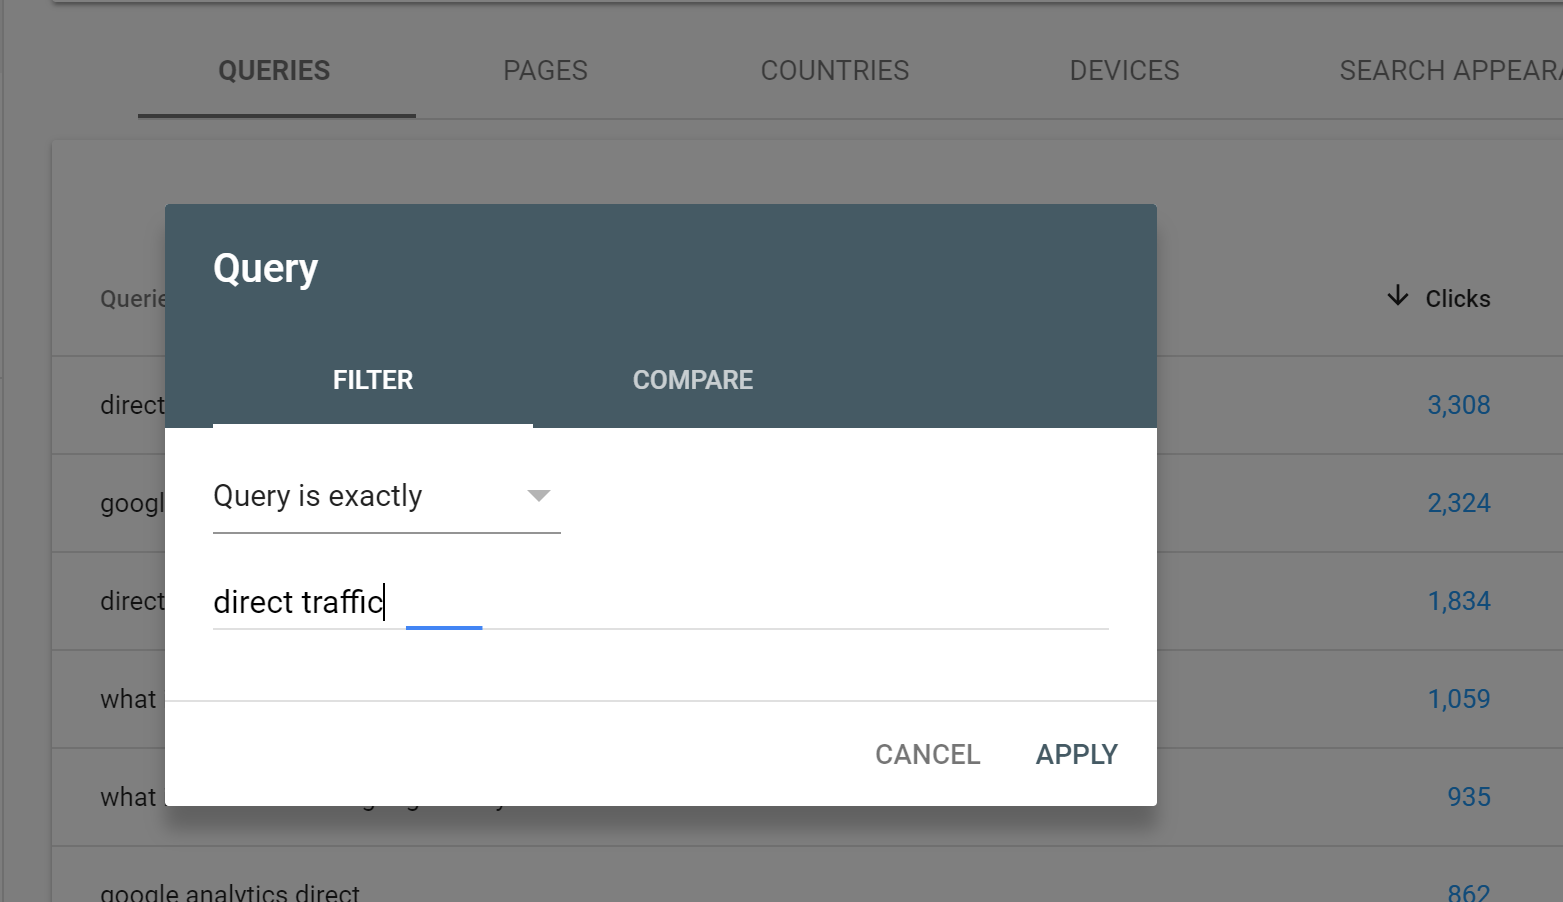
Filtering
What’s really powerful from an SEO perspective, is that you can filter by a specific query (keyword) and see how the client’s page rank has changed over time for that single keyword. To do that you create a filter in GSC for the query. Here, we are creating a filter for only the exact query “direct traffic”
With that filter applied, you can get a better sense for how that page has ranked for its most important keyword over time. You can see that, in the US, the Megalytic blog post was ranking #1 for “direct traffic” for a while, but since April it has slipped down between 2-3.

Check Your Competitors' Ranks
As mentioned above, if we go out and actually do a search for “direct traffic” we can get some more hints about what happened that caused the rank of our content to drop. You can see that the Megalytic post shows up second, and that a post from Moz is ranking 1st. Notice that the Moz post was created less than a year ago, while the Megalytic post is more than 3 year old. So, there are 2 things going on here. First, it is tough to outrank a major domain like moz.com; and secondly the Megalytic content might be getting a bit stale and need an update.
Additional Google Search Console Data to Share
We've focused on the four core search metrics, broken out by Query and Page. This data is critically important to share with every client. But there are other types of Google Search Console data that might be important to include in client reports.
- Crawl: This section includes crawl error data that reveals issues that Google may have encountered when crawling and indexing the client’s website. These are issues like server errors, 404s (missing pages), blocked URLs (access denied). Other information in this section include stats about recent Googlebot activity and malware to identify potential hacking or malicious software on the site.
- Links to Your Site: In addition to knowing about users viewing your client’s site through organic search, it can also be important to know what other websites are linking to content on your website. Links from high quality sites are important for your client's SEO.
- Search Appearance: This section provides a number of reports that help you to optimize how your content appears in Google's search results. The Structured Data section shows how you can optimize the structure of your content to ensure that it is represented well in the search results. Likewise, the HTML Improvements can help you to spot missing elements in your content markup that are important to Google search.
Conclusion
As you can see from the examples here, Google Search Console provides a wealth of data that can help you improve your client's SEO. Be sure to have access to the GSC data for all your client's websites, and to study that data before developing their SEO strategy. As you are reviewing their GSC data, pick out examples to share with them. As we've discussed many times before, the key to a healthy client-agency relationship often comes down to regular, insightful, reporting and discussions about the performance numbers revealed in those reports.

