Identify Problematic Pages
 Obviously, you’ll want to identify high traffic pages where you see a lot of people are dropping off; this is where you will focus on making improvements. However, before you delve into reports, make sure you understand some key metrics, and how to use them. For example, while looking at bounce rate and exit rate can both help to flag problem pages within a site, they do so in different ways.
Let’s examine each a bit closer:
Bounce rate shows the percentage of people who only visit one page on a site and then immediately leave. When you look at bounce rate for a particular page, that statistic reports the percentage of people who first landed on the site through that page and then bounced.
Exit rate shows the percentage of people who left the site from a particular page. When you look at exit rate for a page, that statistic includes the total percent of people whose last contact with the site was on that page, whether they landed only on that page or looked at other pages on the site before getting there.
Bounce rate measures only the people who have visited a single page before leaving, while exit rate measures the total percentage of page views to a particular page that resulted in exits.
High Bounce Pages
First, let’s look pages with the highest bounce rate. To do this, navigate to Behavior > Site Content > All Pages in Google Analytics. Then, click the Bounce Rate column to sort by this metric. Finally, select Weighted from the Sort Type dropdown to make sure you are looking at statistically significant data. A weighted sort ensures you see important pages at the top, so you won’t simply see a bunch of one-hit pages with 100% bounce rate.
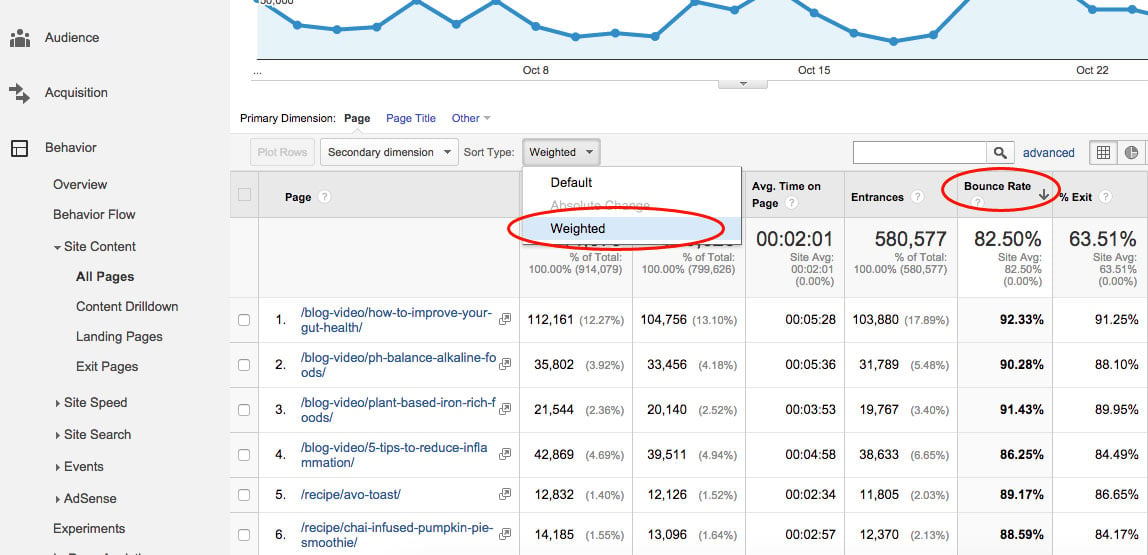
In this example, we see a number of blog articles and recipes flagged as having exceptionally high bounce rates. While hundreds of thousands of people arrive on these pages, most of them are leaving after reading (or not reading) a single article. Ideally, we’d like to see these people browsing through additional articles and recipes, signing up for a newsletter, or purchasing ebooks.
Once we’ve identified these as high traffic/high bounce pages, we can take a closer look to determine why people are leaving and what changes can be made to keep them on the site longer.
We may:
- Navigate to these pages as a user and watch for red flags. Are pages taking a long time to load? Are images broken? Technical problems can deter users from staying on the site.
- Think about adding elements that encourage users to stay on the site longer, such as linking to other relevant posts and products.
- Look at the site on different devices. While you may encounter a positive experience navigating through the site on a laptop, you may find the mobile version difficult to use.
In addition, we should look at where these bouncers are coming from. Add Source/Medium (or Campaign) as a secondary dimension as shown below. If you see that a particular source or campaign is sending a lot of bouncing traffic, you may want to consider revising your marketing strategy – particularly if you are paying for the traffic that is bouncing.
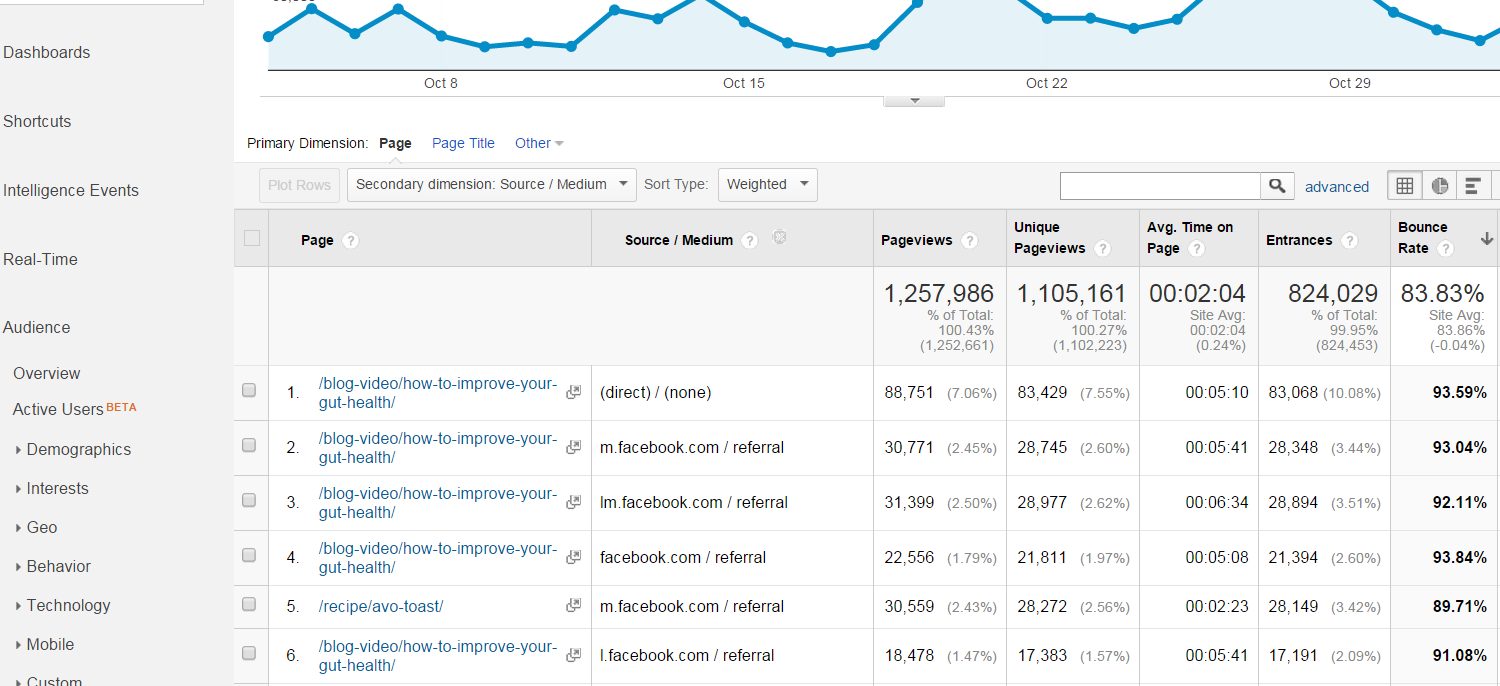
In this particular case, we can see that Facebook is sending a lot of very bouncy traffic. Hopefully, this brand is not paying to promote the posts that are sending this traffic. But, even if it is not paid traffic, some consideration should be made for how to keep all that Facebook traffic engaged with the site.
After looking at pages with high bounce rates, look at pages where people are exiting the site.
Top Exit Pages
To examine a list of top exit pages, navigate to Behavior > Site Content > Exit Pages. This report shows the number of exits and exit rate for each page. By default, it lists the pages with the highest exit volume first. Unfortunately, you can’t do a Weighted Sort for exit rate the way you can with bounce rate, but you can still get a good picture of high exit pages by sorting for exits and eyeing the exit rate column.
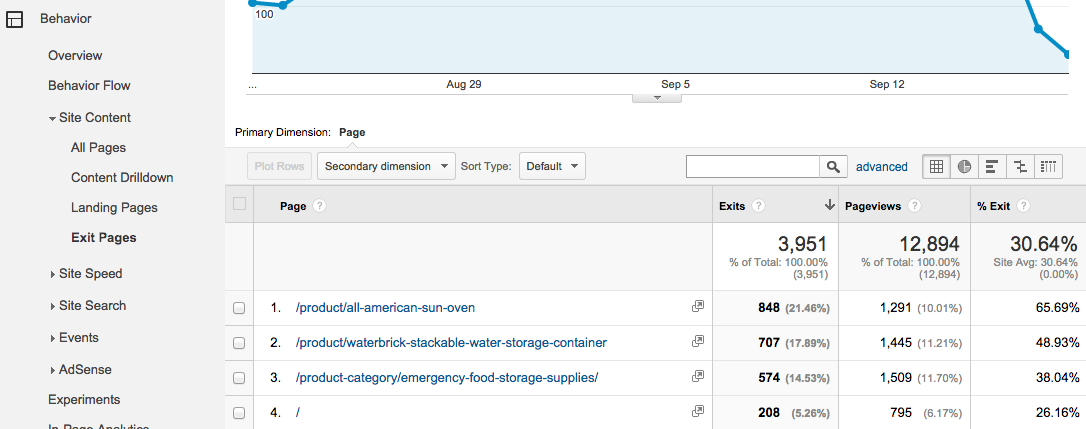
Just as with bounce rate, we see a number of blog posts, as well as a recipe, ranking among the pages with the most exits. However, if you look at exit rates, you’ll notice that the home page, denoted by a single forward slash, only has a 37% exit rate, although it ranks among the pages with the most exits. So, even though a lot of people have left the page, the number of exits is still a small percentage of the total number of people who have viewed the page. Be sure to pay close attention to multiple metrics, not just relying on any single metric.
Note that not all exit pages are inherently bad. For example, on an ecommerce site, if someone exits from a checkout page, that person completed a purchase. That was the desired action. If you link out to affiliate sites where people can buy products, and someone follows that link off your site, again, they have completed the desired course of action. In these cases, an exit is a positive sign.
Looking at high bounce rate and exit pages alone tell only part of the story. You also want to look at the paths users took through a site before dropping off. This will help you to discover what pages led them to the exit pages. If someone exited from a particular blog post, that person may still have read five other articles before leaving the site. In order to look at these paths, use the Behavior Flow report.
Behavior Flow
This report, accessed via Behavior > Behavior Flow in the Google Analytics reporting interface, shows you the most common paths people used to navigate through your site. You’ll see the top pages along with the volume of drop-offs for each step of engagement.
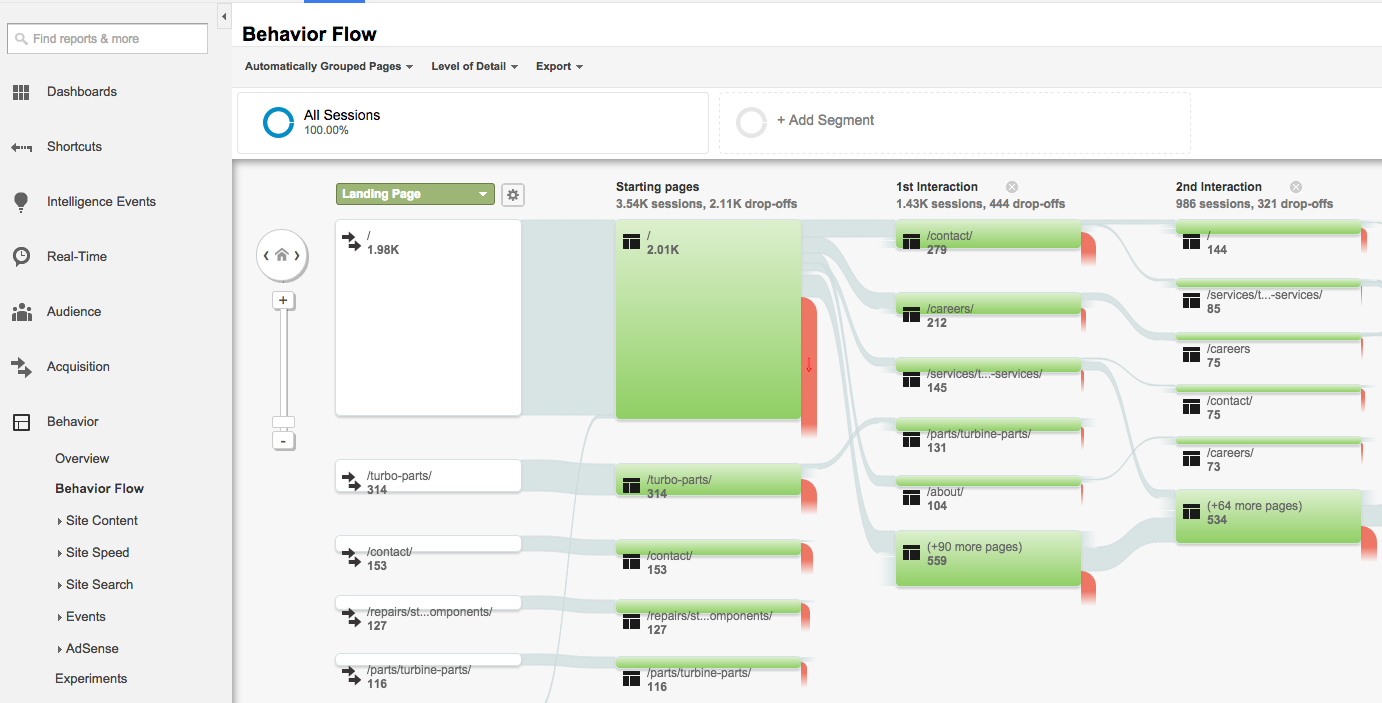
In this example from a company that services turbines, we see most people start on the homepage, with the Turbo Parts category and contact page being the next most common starting points. The second step reveals many people who landed on the site are looking for a way to contact the company or are looking for job listings. However, we also see some research into services and parts represented.
Notice that there is a large drop-off of visitors who start on the /turbo-parts/ page, as indicated by the high percentage red traffic flow exiting that box. It makes sense to have a look at that page and see if it includes links that will help the visitor find the information they need to complete a purchase or request additional information.
Based on the information in the Behavior Flow report, determine what users are most hoping to find upon arriving on the site. Their paths through the site will reveal your most popular pages based on actual use of the site. Check to see if people are following the paths to conversion you had in mind when designing the site. For example, if you want to lead people from your home page to a product information page, to a purchase page, you can see where they are most likely to leave along the way.
Acting on the Data
Once you’ve taken the time to look at high bounce pages, high exit pages, and behavior flow, use the data to adjust your site based on your goals for users. Your goals may include time spent reading content, a purchase completion, or a signup for a trial of your service.
If you find people are not purchasing items you are promoting via your blog posts, then test your calls to action and your placement of promotional material. For example, if you’re currently simply linking to products from mentions in your blog posts, test using graphics to promote items instead.
If you see that people are dropping off after reading one article, test changes to the layout of elements on blog pages. In addition, look at the topics of the articles driving the best engagement compared to those where people drop off. Analytics may help to inform content decisions for the site.
Conclusion
You work hard to attract visitors to your site and to create a great experience. If visitors aren’t sticking around long enough to complete your desired actions – find out why. Review the data, test changes, and review the data again. Monitoring drop-off points in your site will help to keep users longer as well as generate revenue.

