- What happens on your website?
- How do people find your site?
- What pages do customers look at most often?
- What sources drive the most leads?
- And a lot more!

Determining the Data That Matters to Your Business
You can spend hours reviewing endless datasets in Google Analytics—from lists of mobile device types accessing your site to complete lists of pages viewed. But to use data to drive your business, you need to pick out the data most important to making real decisions. Team members who either don’t have time or aren’t heavily involved in data analysis generally won’t care about scouring through endless spreadsheets of numbers—and they won’t. They don’t need more data, they need the right data.
To get it, start by asking questions about what matters to your business. What user actions most directly relate to your business goals? For example, on Megalytic, a signup for a free trial equates to a conversion point as a customer showing interest in the product.
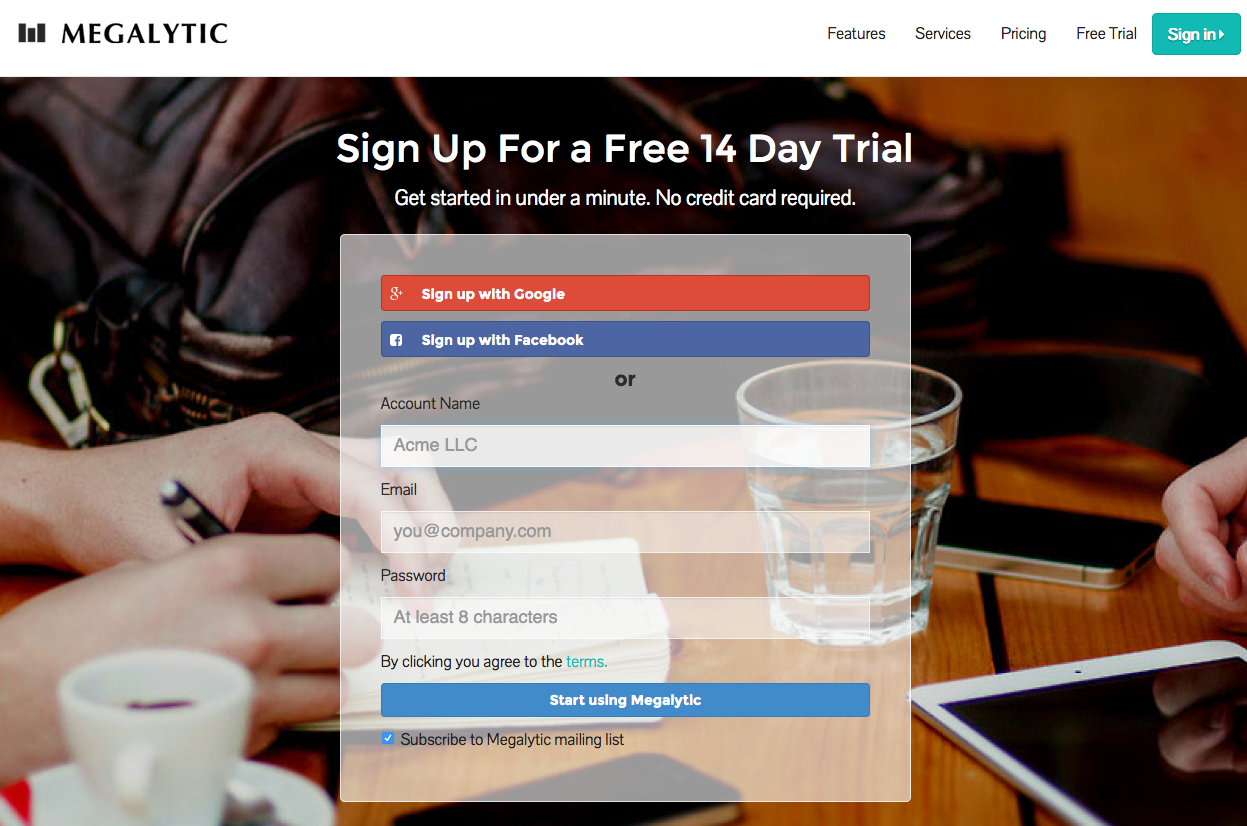
Because the free trial is a crucial point of conversion, we want to measure this point in Google Analytics. To do this, we’ve set up a Goal to track any completions of the free trial signup form. For more information on setting up Goals, see our article on Translating Business Goals to Analytics Goals.
So, how does setting up a Goal relate to managing your business process more effectively? You can now clearly present to your team, not only how many free trial signups occurred, but also what percentage of Sessions resulted in free trial signups (conversion rate) and what sources are most valuable for driving signups.
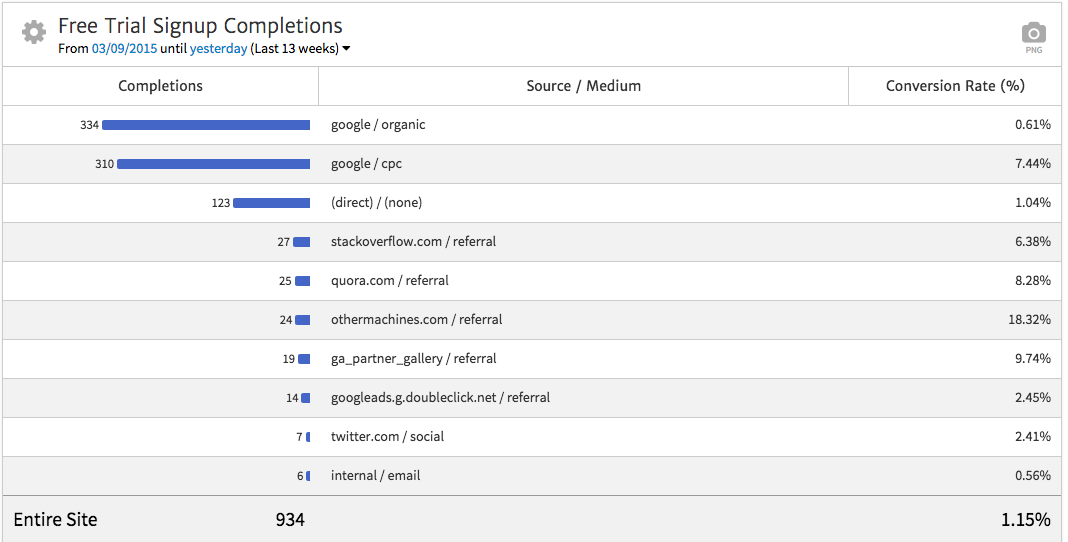
For example, the above widget was built using Megalytic. It shows that the top source for free trial signups over the last 13 weeks was Google organic search. However, most other sources convert at a much higher rate. Google paid traffic (google/cpc) converted at 7.44% compared to less than 1% for organic. This reflects the fact that organic visitors arrived with a variety of intents, such as reading an informational blog article, while paid traffic is driven strictly for the purpose of conversion.
In showing this data, we can now bring up another important factor in driving your business with analytics data: solid reporting. You need to show your team reports that include the right data that matters to your business, with takeaways to help drive business decisions.
Creating Analytics Reports
Regular reporting to your team will help to communicate what’s happening on the website, as well as to reinforce the importance of analytics. In the process of deciding what data is most relevant to your business, you’ll also want to decide how to present that data in a report.
To help, consider who will be consuming your report and create it with their needs in mind. The CEO will likely want to see summaries of high-level numbers. However, the person heading up public relations efforts will want to see a breakdown of results from every placement in online publications.
At minimum, you’ll likely want to report on overall website traffic, user engagement, top channels for traffic (organic search, paid search, social media, etc.), and Goal completions and conversion rates. You should also provide commentary as to why this data is important to your business and what decisions should be made after reviewing it.
In addition, as much as possible, tie website performance directly to tangible business efforts. For example, the graph below shows Sessions broken down by channel for a company that services and installs air conditioners.
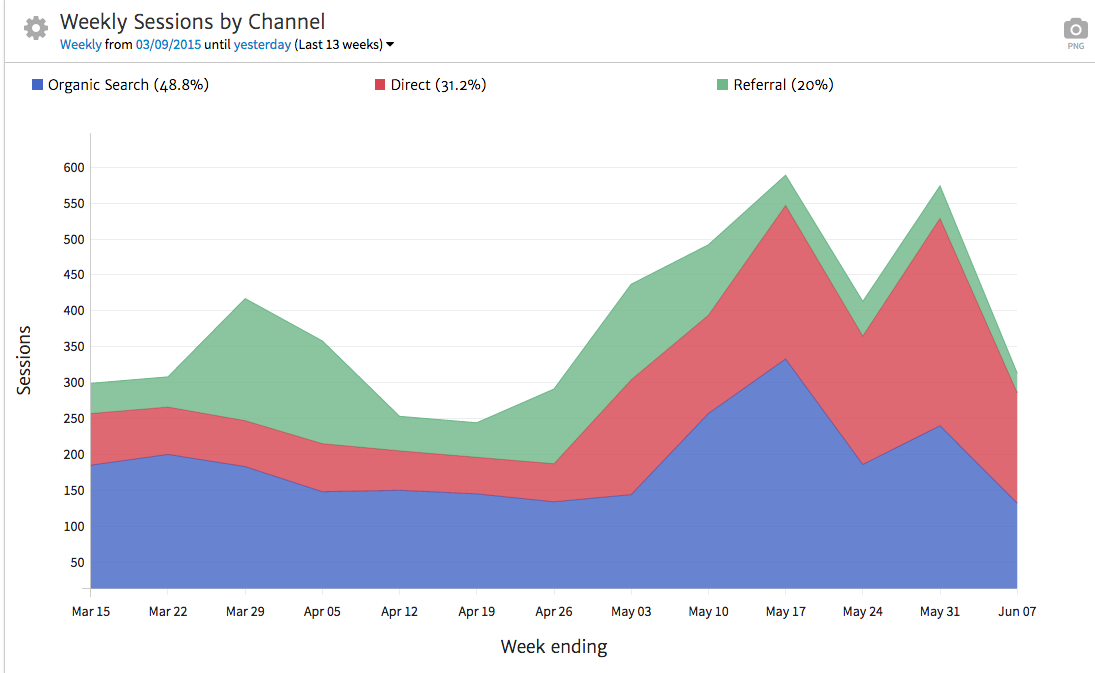
We can see a couple of large spikes in this graph toward the end of the month. Instead of simply handing off this data to the boss, we want to note that these spikes occurred in correlation with hotter weather in which people were more likely to be searching for topics related to air conditioning. This provides context for what our boss is seeing. We can then recommend tactics, like running more aggressive advertising on hot weather days to catch more people possibly interested in air conditioning installation or service.
Acting on the Data
Many businesses say they are interested in data and that they want to understand how it provides insight into what’s happening on their websites. However, they don’t then act on the data to improve their lead generation online.
In addition to handing off carefully-tailored analytics reports, you should also schedule regular meetings to review data in reports and make decisions from that data. This will ensure that the whole team “gets it” and understands how the data is applicable to their work. Having someone present to explain the data will help everyone interpret the report properly.
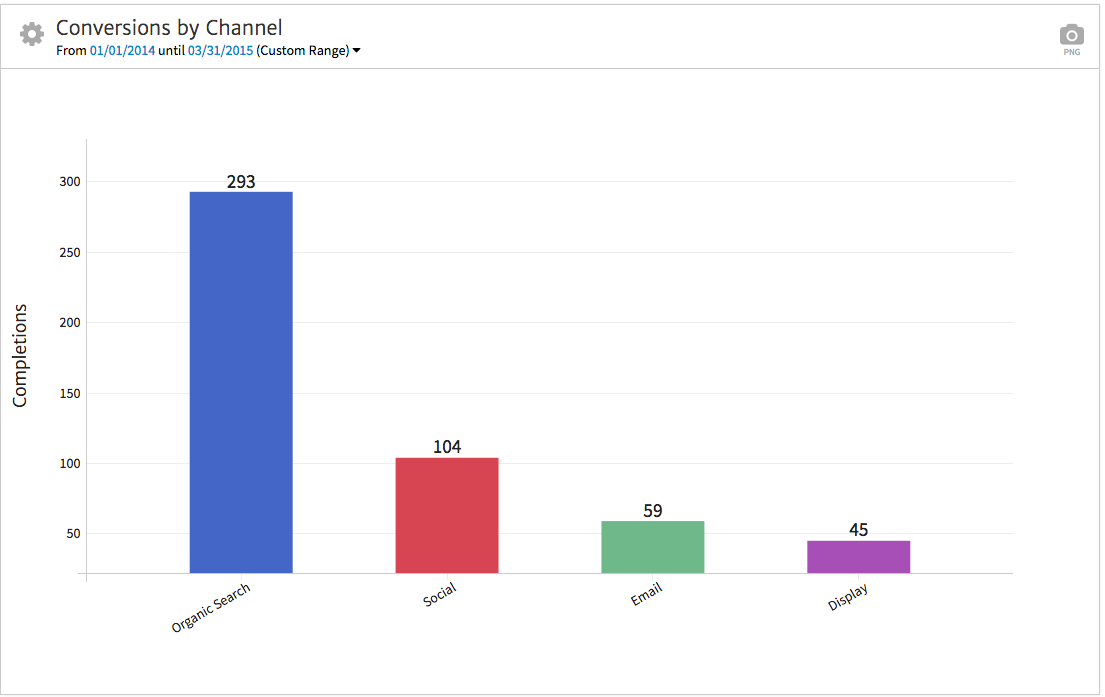
For instance, in the following graph, we’re showing Completions by Channel for an eguide purchase. When presenting this data to the marketing team, we should identify the opportunity to test email marketing to help increase conversions from email, since that source seems lower in volume.
Everyone involved in the marketing process, from those managing social media to those responsible for crafting email copy, should be involved in reviewing and discussing analytics reports. For example, in this case, a copywriter, graphic designer, developer, and email marketing manager may all be involved in the process of planning emails.
Each team member should be encouraged to provide their input on the data and how it applies to the business’s marketing plans moving forward. Seeing information that directly relates to work that they do will help to drive a mentality of making data-informed decisions (and accountability).
To continue driving your business with analytics, make sure that you’re continuing to refine online marketing efforts using the data you have available. If you’re planning for a change based on data, such as improving email marketing, look at your conversion volume and conversion rates to start, and compare these to results you see after testing new efforts.
Conclusion
Analytics should form the foundation for your business’s marketing efforts. To get there, work with your team on understanding the data that they see in analytics, presenting reports, holding regular discussions, and explaining actionable recommendations from the data.
Soon, you’ll see your team members coming to you to ask for information on analytics and how it applies to their work. You’ll see them wanting to test and refine marketing efforts based on the data that comes back into analytics.

