ROAS measures how much of your advertising spend you got back in revenue. ROAS is never a negative number because in the worst case your ads produced 0 revenue and ROAS would be zero.
What Does ROAS Mean?
ROAS is the "bang for the buck" that your advertising delivers. It tells you how much money you are getting back, as revenue, for each dollar you spend on advertising.
When to Use ROAS
ROAS helps with allocation. It is the right metric to use when you are deciding where to invest your advertising budget. For example, if you spend $1,500 per month running Display ads, and the customers clicking through are purchasing $7,000 per month from your web store, then the ROAS for your Display ads is $7,000 / $1,500 = 4.67.
By comparison, suppose you are also spending $4,000 per month on PPC campaigns, and the customers clicking through those ads are purchasing $12,000 each month. Then the ROAS from PPC ads is $12,000 / $4,000 = 3.00.
In this example, you are getting a better return on Display ad spending than on PPC. Display ads are returning $4.67 in revenue for every $1 spent whereas PPC ads are only returning $3.00 for every $1 spent. Other factors being equal, the ROAS metric suggests that you should shift some spending from PPC to display ads.
ROAS vs ROI
ROAS seems a lot like Return on Investment (ROI). The difference is that ROI looks at profit rather than revenue:
Going back to our example, if we wanted to calculate the ROI from our Display ads, we would need to calculate the profit being made on the $7,000 in web store purchase being made. The profit formula is going to look something like this:

The problem here is that many of these terms require us to get the accounting department involved. Like the Cost of Goods Sold. If we keep track of which items were sold by the ads, and what the cost of these items are on our books, then maybe we can calculate the Cost of Goods Sold. However, the Allocated Operating Costs is likely to be more tricky. That cost depends on the business's accounting policies. And many businesses do not have a defined policy for allocating operating costs to individual sales.
For many businesses, it is impossible to assign a profit to the sales resulting from a particular advertising campaign or type of advertising. Even for businesses that have this data, it might be too cumbersome to acquire and process in a timely manner when you need to optimize your ad spend.
ROAS is a lot simpler to calculate that ROI. That's why many marketers use it as the default metric for optimizing advertising spend.
What's a Good ROAS
An acceptable ROAS depends on the objectives and profitability of your business. 4.00 is a commonly accepted benchmark for ROAS. That is $4 in revenue for every $1 in ad spending. But, that number won't work for everyone. For example, if you run a web store with thin operating margins, 4.00 may be too low. Let's say your gross margins are only a 20%. Then, 4.00 ROAS means that you are spending 25% of revenue on advertising - eating up all of your gross margin and actually losing 5% of revenue on each sale!
On the other hand, if your business sells a high margin item like a subscription, then your operating margins might be 70% or more and you can make a killing with a ROAS of 4.00.
Lastly, a startup, or other business that is pushing hard to gain market share, might be able to tolerate losses on new business. In such a situation, a low ROAS might be acceptable in order to win over new customers.
When using ROAS to evaluate your advertising, it's best to work with accounting and senior management to determine what ROAS targets are appropriate for your business.

Challenges in Tracking ROAS
Like most marketing metrics, ROAS is a statistic that is difficult to measure precisely. You will need to do some back-of-the-envelope estimation. The estimation techniques you use will depend on the type of business you are in, but they will center on two concepts: marketing attribution and customer lifetime value.
Marketing Attribution
How do you know which users became customers a result of the ads you are tracking? In the simple case, a user clicks on an ad and makes a purchase. This revenue clearly belongs in the ROAS calculation. But, what if the user clicks, but doesn't buy right away? What if they click and go away, but two days later they see a post for your web store on Facebook, and then they come back and buy? You can argue that this customer should be counted because they first found your store via the ad campaign. Or, you could argue that the Facebook post gets the credit since that was the last click before purchase. A third option would be to split the revenue between the initial ad and the Facebook post.
Marketing attribution is the art and science of deciding how much credit your initial ad gets for this customer. The are many different methods (attribution models) for assigning credit. As far as ROAS tracking is concerned, what's important is that you pick a single attribution model and use it consistently when comparing ROAS across channels or campaigns.
Customer Lifetime Value (CLTV)
The other challenge in tracking ROAS is estimating how much revenue is generated by an ad campaign. The difficulty here is accounting for repeat business. In the web store example, a customer who clicked an ad might make an initial purchase of $100. But, that same customer may come back each month for a year - always spending about $100. In this case, the Customer Lifetime Value (CLTV) is 12 x $100 = $1,200. For tracking ROAS accurately, we'd like to use the CLTV of $1,200 rather than to immediate transaction value of $100. But, how can we know that this customer will make future purchases or how much they will buy in the future?
The answer is that you need to estimate the CLTV for the customers that your ads are bringing in. To do that, you might want to look at historical data and see how much has been purchased, on average, by customers clicking on ads. In addition, in some types of businesses (e.g., subscription businesses) CLTV can be modeled based on other measurable factors like churn rate. David Skok provides an excellent introduction to calculating CLTV for SaaS subscription businesses in his post Saas Metrics 2.0 - Detailed Definitions.
Google Analytic's ROAS Metric
At this point some of you may be thinking:
I don't need to figure out how to estimate ROAS, my analytics tool calculates ROAS for me.
While it is true that many tools provide ROAS reporting, it is important to understand how your tool is making the calculation, in order to determine if its ROAS reporting is valid for your business.
For example, consider the ROAS reported in Google Analytics. If you have linked your AdWords and Analytics accounts, and you also have Ecommerce tracking set up in Google Analytics, then you will have the ROAS metric available. Open the Acquisision > AdWords > Campaigns report, select the "Clicks" tab, and check out the rightmost column.
Google Analytics ROAS for an Ecommerce Business
The example below comes from an Ecommerce business that tracks checkouts using Google Analytics Ecommerce.
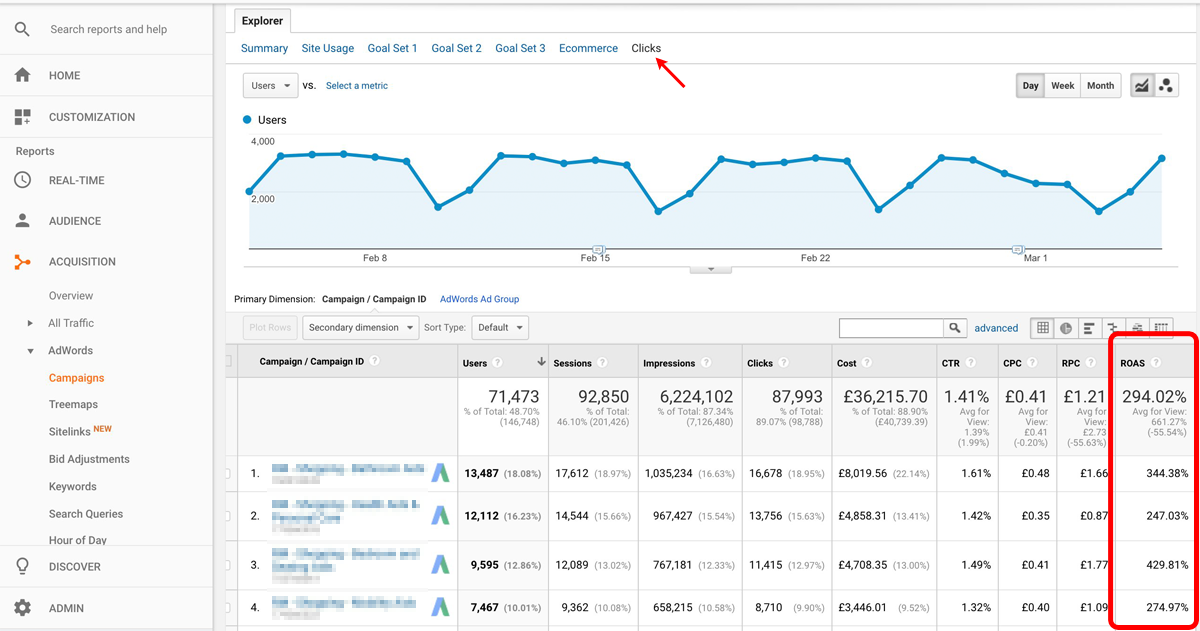
In the example above, you can see that the ROAS for this entire account is 2.94 (Google shows it as the equivalent percentage: 294%). Now, how do you supposed that was calculated? Well, you can see (above) that the Cost reported by Google Analytics is £36,215.70. To find the revenue, click on the Ecommerce tab.
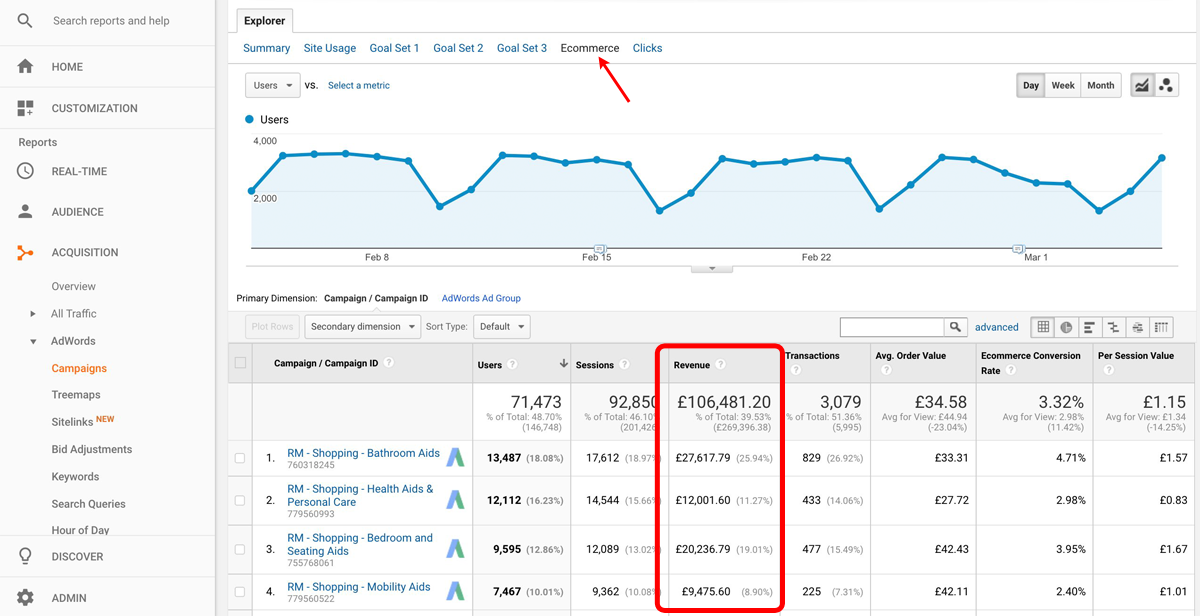
So, the Ecommerce revenue reported by Google Analytics is £106,481.20. To get ROAS, Google simply applies the formula we introduced at the beginning of this post:
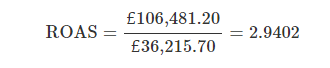
In Google, ROAS (return on advertising spend) is calculated by dividing the conversion value (based on e-commerce revenue and/or goal value) by the ad spend. But, does this accurately reflect the effectiveness of the AdWords advertising? Since this is an Ecommerce site, it is probably not too bad. The biggest shortcoming is that the Revenue number only includes purchases made during the last 30 days (the reporting window used in this Google Analytics report). Since some (maybe a lot) of these customers may come back in the near future to make additional purchases, £106,481.20 probably does not represent all the revenue attributable to the ads run during the last 30 days.
The other potential inaccuracy here arises from the fact that Google's cost only includes the amounts paid to Google AdWords for running the ads. But, there was also cost in writing the ads, designing graphics for the ads, managing the keyword bids and placements, etc. To be completely accurate, we should include all of the non-Google costs as well.
But, despite these shortcomings, in this Ecommerce case, the ROAS calculations are not too bad, and certainly good enough for comparing the results across different AdWords campaigns, ad groups, or ads.
Google Analytics ROAS for a Subscription Business
As a comparison, let's look at another company - this one is a subscription business. This company also track checkouts using Google Analytics Ecommerce.
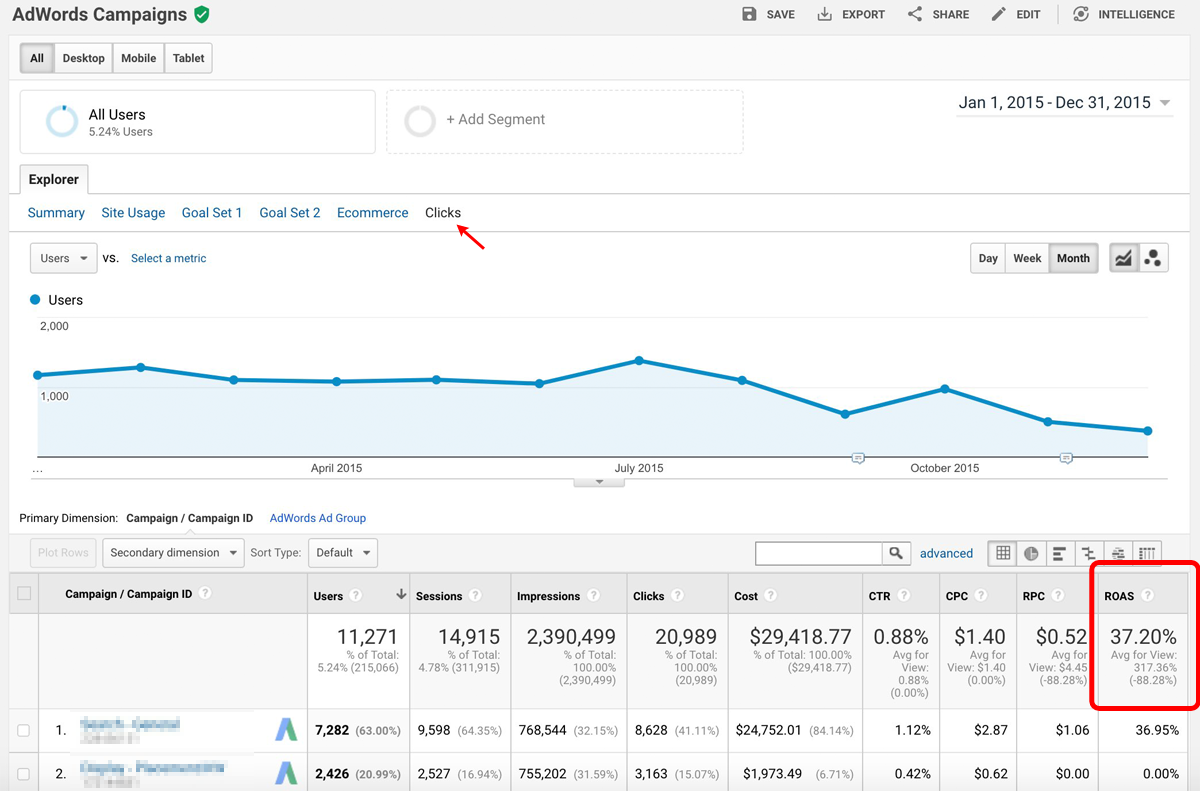
In this case, the ROAS is 0.37 (Google shows it as the equivalent percentage: 37.20%). That appears to be a terrible result. In theory, it means that this company is only getting 37 cents back for every $1 they are spending on advertising.
The Impact of Understating the CLTV
But, in this case, the ROAS calculation is flawed because Google Analytics Ecommerce does not capture all of the subscription revenue. In fact, it only captures the first month.
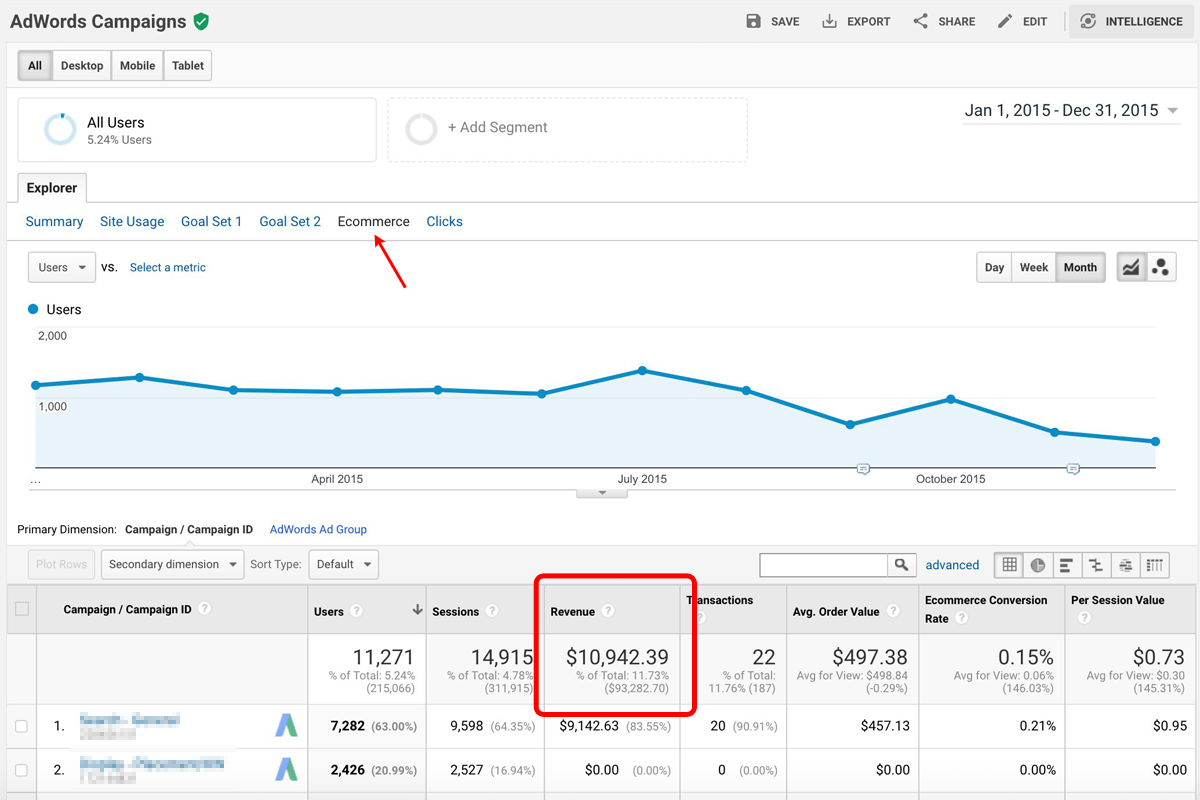
The revenue reported here ($10,942.39) represents only 1 month of revenue for each customer purchasing a subscription after clicking on an AdWords ad. That's because the Ecommerce tracking only picks up the checkout for the initial monthly payment made on the website. Subsequent monthly charges are applied directly to the customer's card and do not flow through Ecommerce tracking.
As a result, the CLTV is way off here. In fact, in this business, we know (from sources outside Google Analytics) that the average customer remains a subscriber for 21 months. So, the revenue estimate from these ads should actually be 21 x $10,942.39 = $229,790.19. And likewise, the ROAS should be adjusted:

Wow! So it turns out that AdWords is working really well for this subscription business. That's the exact opposite of what the ROAS number (0.37) straight out of the Google Analytics report was telling us. That's why it is so important to know what's going on "behind the scenes" with the numbers reported by your analytics tools. If you trust the numbers blindly, you can make some big mistakes.
Attribution Problems
You should also be aware that CLTV problems are the only source of errors in the ROAS reported by Google Analytics in this case. There are also attribution errors. Specifically, this Google Analytics report uses the Last Non-Direct Click attribution model to determine which transactions should be attributed to the AdWords ads. The Last Non-Direct Click model ignores direct traffic and attributes 100% of the conversion value to the last channel that the customer clicked through from before buying or converting.
But, if the person clicks on an ad, comes to the website, signs up for a trial and then later makes a purchase after clicking on a social media post, or doing an organic search, that customer's revenue is not counted. That model doesn't seem quite right. After all, the ad introduced them to the product, and they signed up for a free trial. Should the ad get credit for some of the revenue from this customer?
After correcting for attributions problems, the ROAS might be even higher than 7.81 in this case.
Conclusion
Return on Advertising Apend (ROAS) is a powerful metric for evaluating the relative effectiveness of advertising campaigns. Before using it, however, make sure that you understand the characteristics of your business that determine what your target ROAS should be. High margin businesses can make money with a very low ROAS. But businesses with lower operating margins may need a relatively high ROAS to avoid losing money on digital advertising.
Also, if you use a tool (like Google Analytics) to calculate ROAS, make sure you understand how the tool is making the calculation. Depending on your business model, and how you have set up your tool, the ROAS calculation could be quite accurate or way off.

