
Lead Generation vs Ecommerce
If we were talking about an ecommerce business, attributing revenue to specific channels would be pretty straightforward. Thanks to Google Analytics Ecommerce tracking, you can quickly pull a report to see how many people purchased products via the site, how much they paid for those products and how much revenue social media drove vs. organic search. All the information you need is there for the taking.
But when a site is set up for lead generation, attributing revenue can be harder to track. Lead generation sites rely on visitors filling out a form, making a phone call or requesting additional information. Then, the conversation often goes offline, and the conversion doesn’t happen until much later in the funnel.
These actions need to be tracked as Google Analytics Goals. The data you collect from tracking goals provides the key metrics for reporting on lead generation.
It’s All About the Conversions
The most important lead generation metrics are the ones that relate directly to goal conversions. Key metrics include:
- How many conversions are coming through the site?
- What percentage of website visitors convert?
- Which channels drive those conversions?
- If you are sending people to the site via ad campaigns, how much does the average conversion cost?
Our first step is to show a breakdown of total conversions by channel. This will help provide an overall picture of conversion data while showing the success of SEO, PPC and other online marketing efforts.
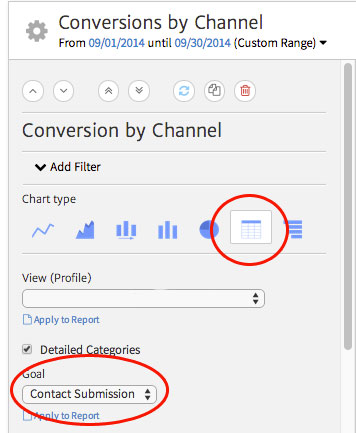
In Megalytic, you can show this data via the Conversions by Channel widget. After adding the widget to a report, we’ll select a specific goal to track (in this case, a “contact us” submission form). In addition, we’ll choose to display the data in a table format for straightforward presentation of numbers.
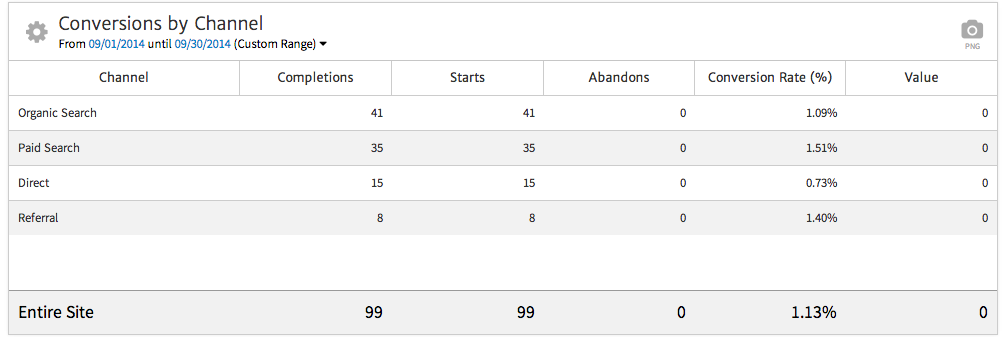
Once we’ve made these selections, the widget’s table shows a breakdown of contact form submissions. In this example, organic search drove six more conversions than paid search, but paid search traffic shows a higher conversion rate. That data reflects the fact that paid search drives in people with the direct intent of conversion, while organic search may include a wider audience.
If your website has multiple lead-generation goals, this same widget can be used to create a table for each type of conversion. For example, an auto dealer’s report might contain separate tables reporting on new car inquiries, used car inquiries, and service requests.
Of course, looking at just this month’s conversions doesn’t tell the whole story. You also need historical context to compare against past performance.
Compare to Previous Periods
Businesses rely on being able to compare today’s performance to previous months and years. The lead generation process needs to constantly improve and historical comparisons allow us to track progress.
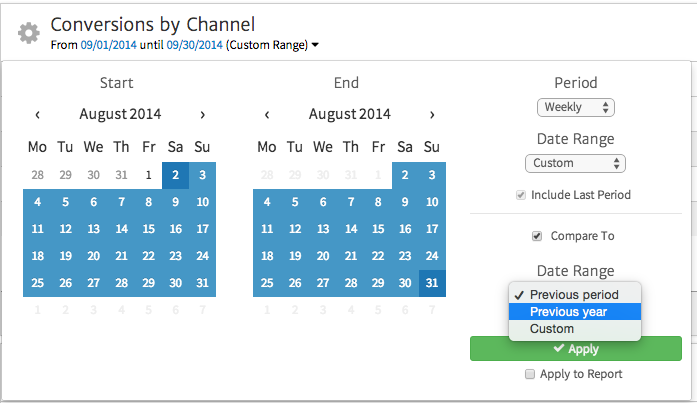
While the report referenced above shows us volume of conversions and conversion rates, it provides no context to help us determine whether these numbers are positive or negative. To add a historical comparison, we’ll take the same widget and click the arrow by the date range. In the dropdown, check “Compare to” and select a date range for comparison. In this case, we’re comparing to last year.
Here, we see volume of conversions compared to September of last year. Unfortunately, it shows the numbers have decreased significantly, a red flag indicating that the lead generation process needs attention.
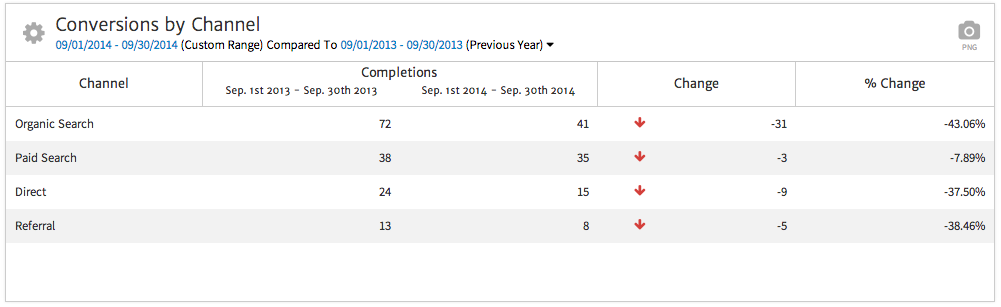
This table helps to diagnose where conversions are suffering the most. In this case, paid search only shows three fewer conversions, a decrease of just 8%. However, organic search shows 31 fewer conversions, a major decrease of 43%. Based on this data, we can likely flag organic search issues with the site, causing us to investigate beyond straight-up conversion metrics. For more information on showing organic search trends, see our post on showcasing organic traffic.
User Engagement
While conversions measure our ultimate lead-generation goal, looking at general website engagement also helps to provide a picture of how well the site works toward its goal of lead generation. People may visit a site multiple times, reading blog articles, watching videos or researching service pages, before choosing to contact the company.
To see if people are continuing to engage with your website, analyze how often your users are returning to the site after a first visit. The Frequency and Recency widget in Megalytic reports on how many times uses visit your site.
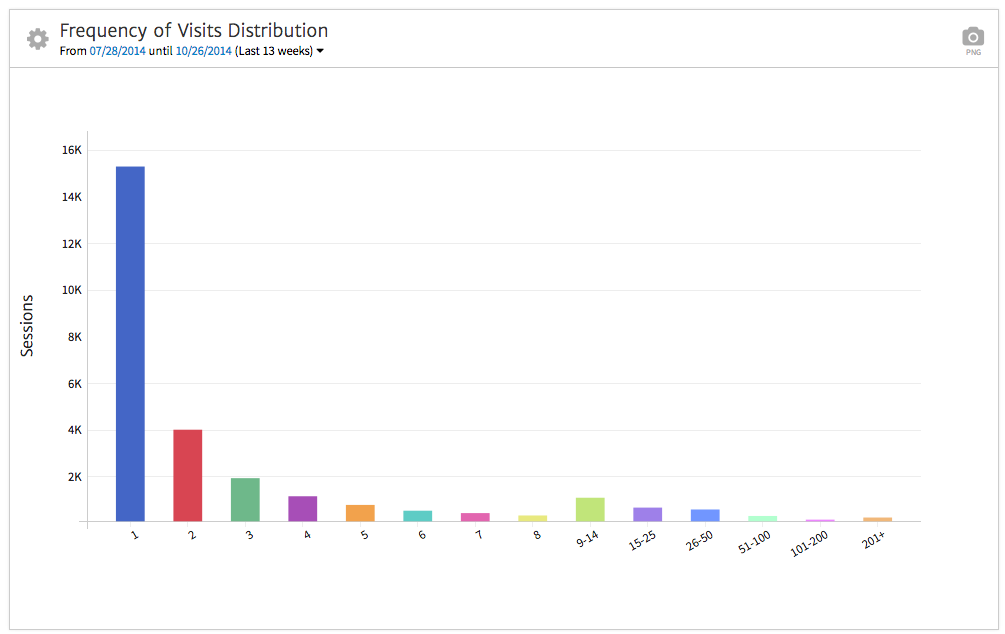
In this screenshot we see most users spend just one session on the site. Around 4,000 sessions were second-time visits, while third-time visits go below 2,000. Only a small fraction of people return beyond that number of sessions.
Based on this information, your company should set goals for return visits, measure them, and report on progress. Once goals have been established, strategies such as remarketing with display ads can help get people back when they may not have initially been ready to contact the business for services.
Using Events to measure positive engagement describes some other ways to measure engagement.
In addition to looking at return visits, your report should break down engagement by channel. This data can help to determine which channels drive people who are likely to later convert into leads.
To do this comparison, we’ll add the Engagement by Channel widget. Then, we’ll select our date range and compare to the previous year, as we did with the Conversion widget.
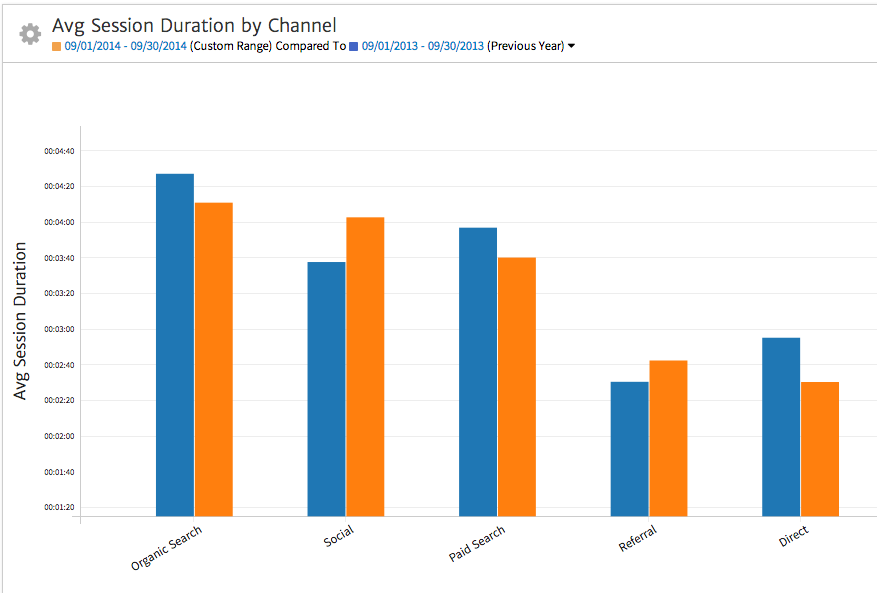
This report now shows a breakdown of average session duration by channel, compared to the same period last year. We can see that organic search and paid search have suffered a decrease in average time, while social and referral traffic have increased.
This information can guide marketing decision makers to allocate more effort to converting people from the channels driving more engagement. For example, paid search and organic search drive the majority of conversions, but social drives an increasingly engaged audience to the website. Carefully targeted Facebook and Twitter ads could help convert these engaged visitors to customers.
Conclusion
Analytics reports for lead generation websites should focus on conversions, but should also show engagement statistics that identify the potential value of traffic coming from channels that may not be currently converting. Take the time to show how statistics have increased or decreased over time across marketing channels A carefully-crafted lead gen marketing report will examine the current sources of conversion as well as identify channels where engagement indicates an opportunity for additional conversions.

