
How Does Google Analytics Sample Data?
Think about it – if your site receives thousands of Sessions a day, that’s a large volume of data for Google to process. To be able to efficiently serve marketers the reports they need and keep Analytics free, Google uses a random sample of your full data set to estimate the metrics for a high traffic site. This allows Google to quickly generate reports on the spot, including those requiring extra customization and processing power.
Note that this sampling kicks in when over 500,000 Sessions occurred in an Analytics property over the timeframe being viewed.
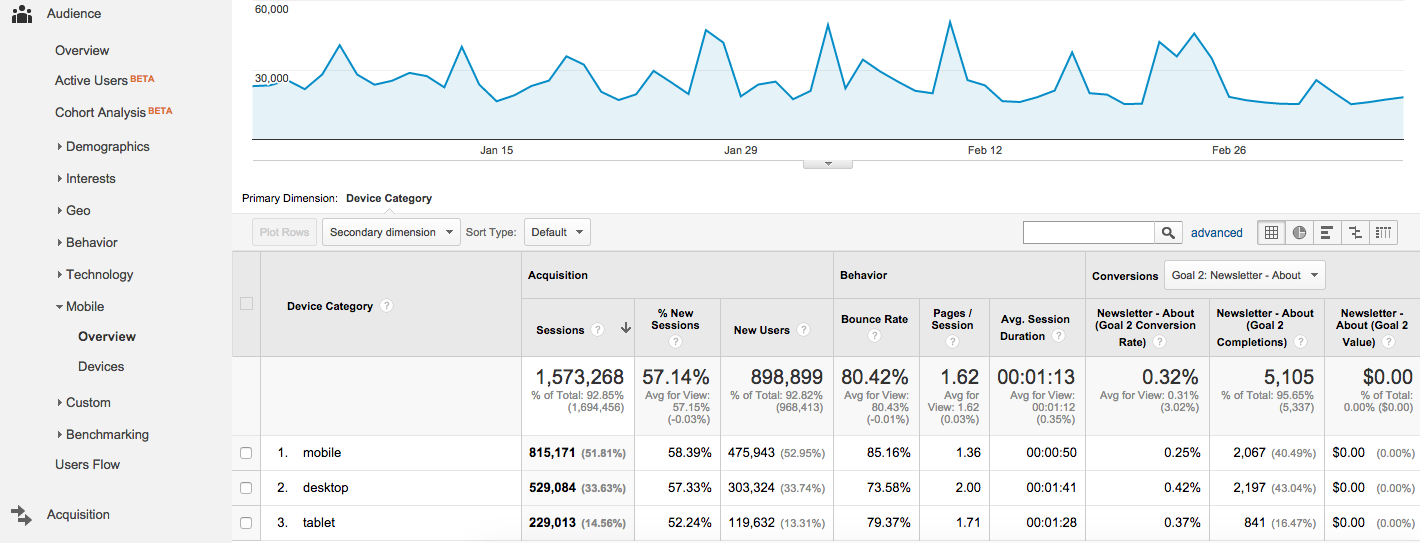
For example, let’s take a look at a Mobile Overview report for a site that received more than a million Sessions within the past two months. We see a basic breakdown of mobile, tablet and desktop Sessions, in a report showing unsampled data for all metrics.
Now, say we want to see where users from these devices came from. We’ll apply a secondary dimension to add Default Channel Grouping to the report. This will further break down the data to show which channels, such as Social, Organic Search or Paid Search, contributed to Sessions by device category. The screenshot below shows the same report with this dimension added.
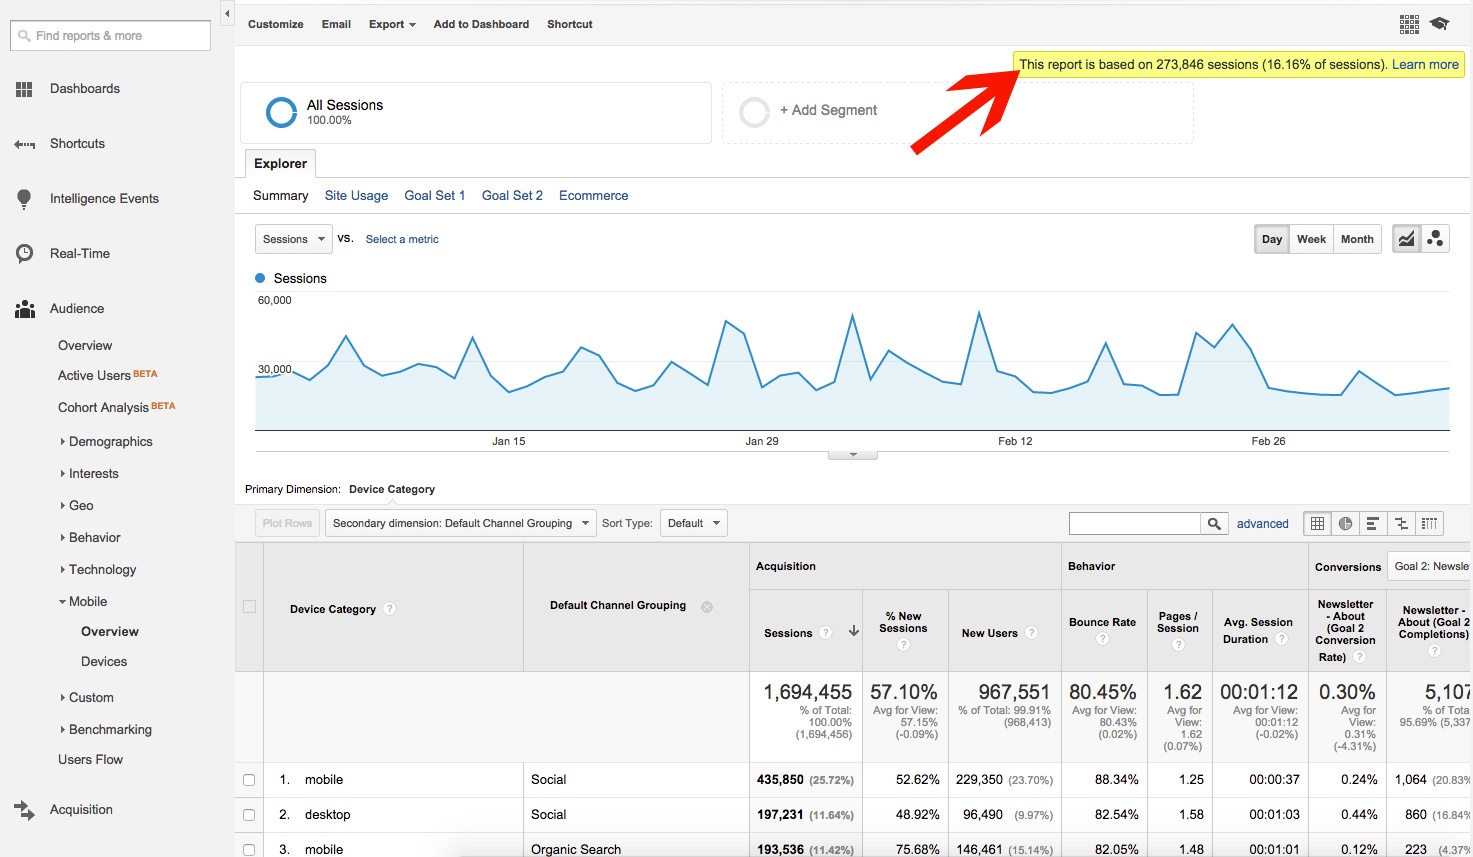
A yellow bar alerts us that this report is based on about 16% of total Sessions for this time period. This means that Google Analytics is calculating the metrics in this report from a randomly selected subset of the Sessions and using the results to estimate the values for all the Sessions.
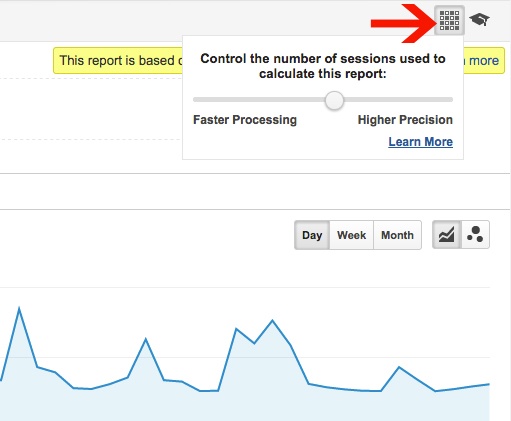
Above the yellow bar, you’ll see a symbol that looks like a grid of boxes. Selecting this will allow you to adjust the accuracy of sampling. “Faster processing” means that Analytics will use fewer Sessions to calculate metrics, resulting in less accurate numbers. “Higher precision” will use more Sessions to calculate metrics, while possibly increasing the time necessary to create the report.
We’ll move the slider all the way to the right for the highest precision possible. Once we apply the change, we see the report data change once again.
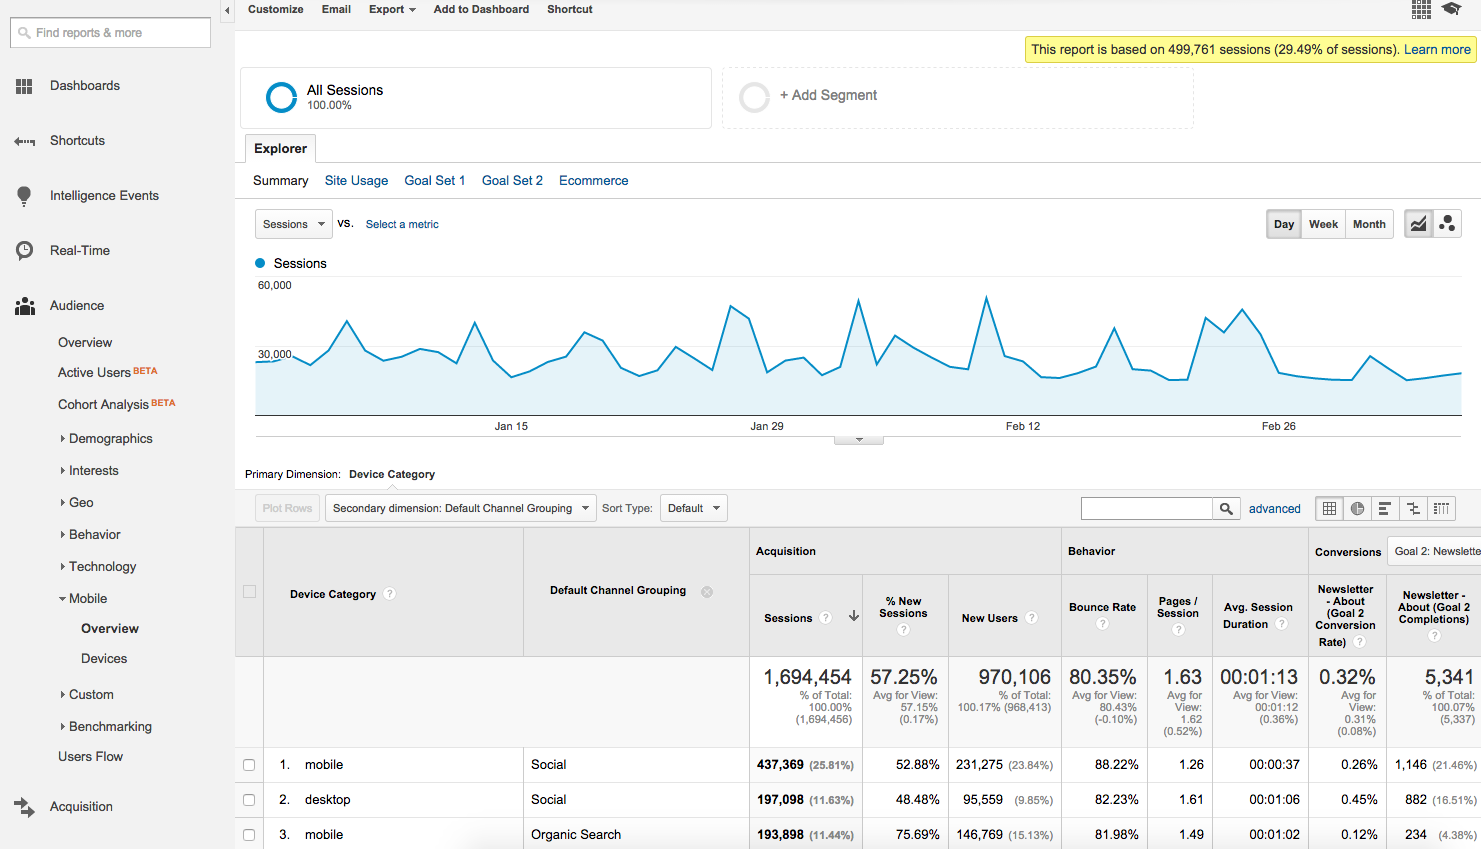
Now the yellow bar at the top tells us the report is based on close to 500,000 Sessions, or 29% of total Sessions. If we compare the first example (data sampled at a normal level) with the second (data sampled at the highest precision), we see several discrepancies in numbers. Every number in the first report differs to at least some extent from the second report. We can note a few specific differences:
- Total Sessions increases by a single Session in the report with less precision.
- The number of New Users is greater in the report with higher precision.
- Mobile Sessions from Social are greater in the report with higher precision.
- Desktop Sessions from Social are greater in the report with lower precision.
- Overall Bounce Rate varies by a tenth of a percent.
What Does Analytics Data Sampling Mean to You?
We see that the numbers can vary when sampling kicks in, but what do these differences mean to you as an analytics professional? You should be aware of the potential for data sampling to impact your analytics reports in a number of ways.
Understand Numbers Won’t Always Match Up
First, simply be aware that when looking at large volumes of data, numbers may not match up 100% throughout the account. While analytics provide invaluable data about website performance, take into account the potential for variance. Numbers for the same metrics can vary depending on what reports you’re viewing, what segments or secondary dimensions you’ve applied, and what precision level of sampling you’re using.
For most purposes, the variations resulting from sampling are not material. They usually do not have any impact on the insights to be gained from the analytics. For example, if your reports are showing that conversion rates are lower for mobile users than desktop users – sampling variance may show that mobile is 25% less the desktop at one point, and 24.3% less than desktop at another. But, the basic result – that conversion rates are significantly lower on mobile – holds regardless of the sampling.
Less Concern for Low Traffic Sites
If your site doesn’t receive a high level of traffic (say, less than 1,000 Sessions per month), you likely won’t have to worry about the effects of data sampling, as a report needs to be analyzing at least 500,000 Sessions for sampling to kick in. However, keep in mind that even a site with what may not seem like a heavy volume of Sessions can still encounter sampling when filtering the date range to include long periods of time, such as several years of data.
Shorter Periods of Time, More Accurate Data
If a report indicates that data is being sampled, and you really want to avoid sampling, you can break that report into shorter periods of time that fall under the 500,000 Session threshold. For example, say that we want to view how many Sessions from mobile devices resulted in newsletter signups in the month of January. As shown earlier, we set up a report with a secondary dimension to view this data, only to receive another message that sampling is occurring.
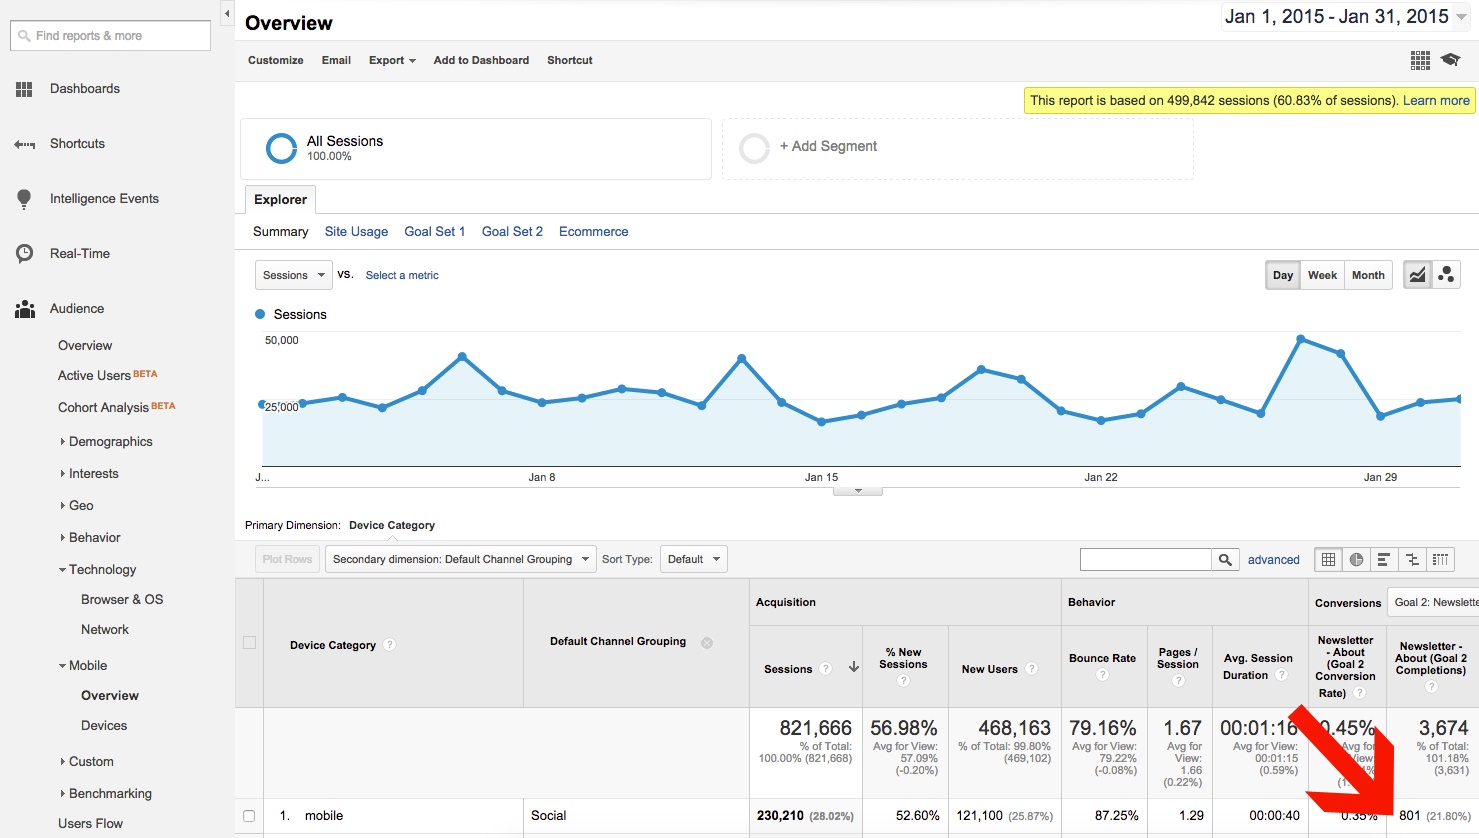
In the screenshot above, we see a total of 801 newsletter signups coming from Mobile sessions that arrived via Social channels. However, we know from the sampling warning that this number may not be entirely accurate. However, we can split the time period up to look at the first half and the last half of the month separately. When viewed separately, these periods of time do not meet the 500,000 Sessions threshold.
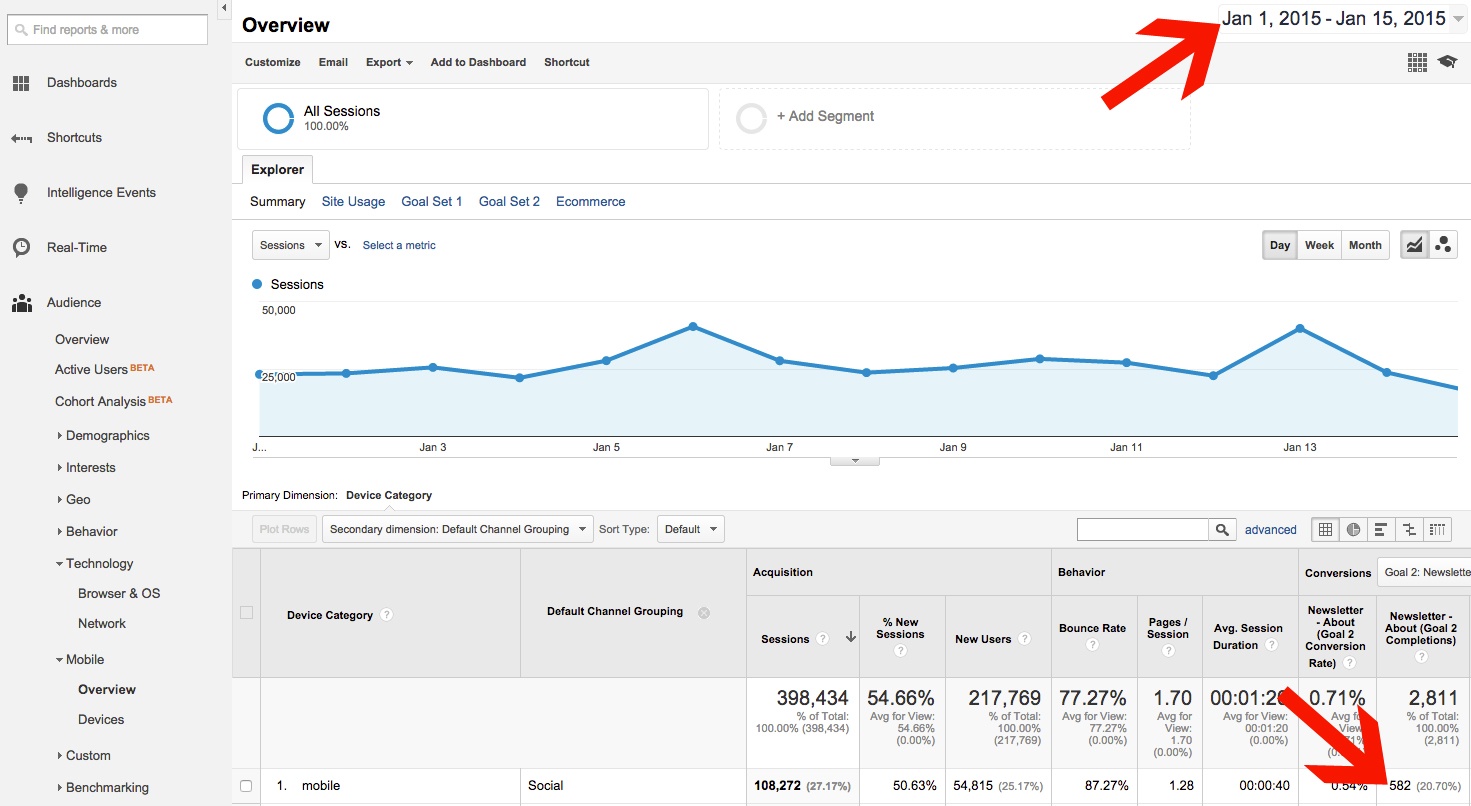
First, January 1-15 shows 582 newsletter signups for this subset.
Next, January 16-31 shows 203 newsletter signups for this subset.
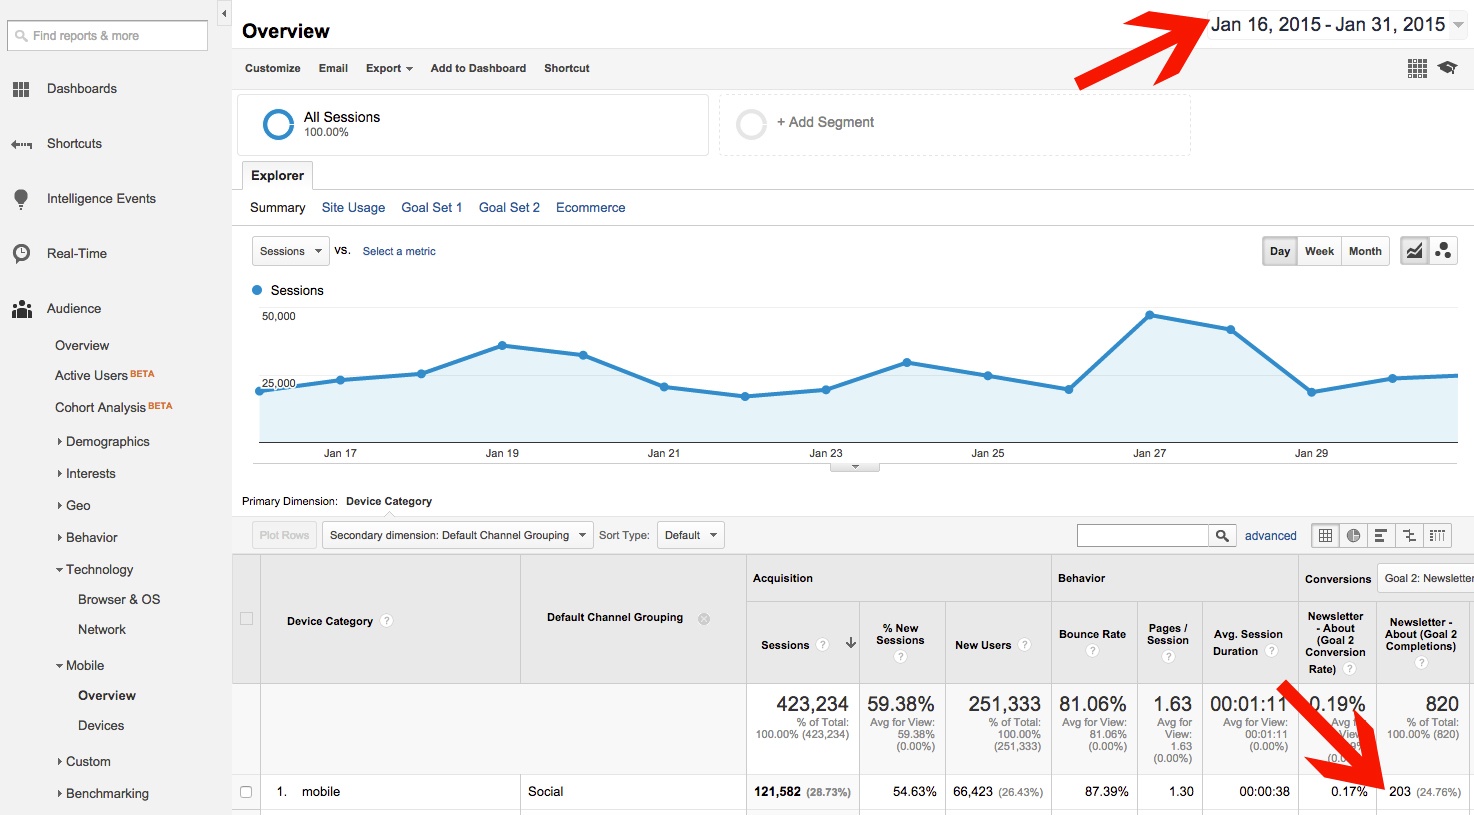
Adding the number of signups from these date ranges together, 582 + 203 = 785. Our final number is lower than the initial estimate of 801 from the sampled data.
Consider Google Analytics Premium
If your data is frequently limited by sampling due to high traffic volumes, you can upgrade to Google Analytics Premium, which places a much higher threshold before data begins to be sampled (twenty five million as opposed to 500,000). However, the $150,000 annual cost makes this a viable option primarily for larger enterprises.
Conclusion
While data sampling falls under the more technical aspects of analytics, understanding it on a basic level will help guide your interpretation of Google Analytics data. When preparing reports for clients or your boss, you can keep in mind to note when data becomes sampled, realizing that numbers become estimates from a smaller subset of data, and compiling data from shorter date ranges when necessary to ensure more accurate data.

