Google Analytics Demographic Targeting
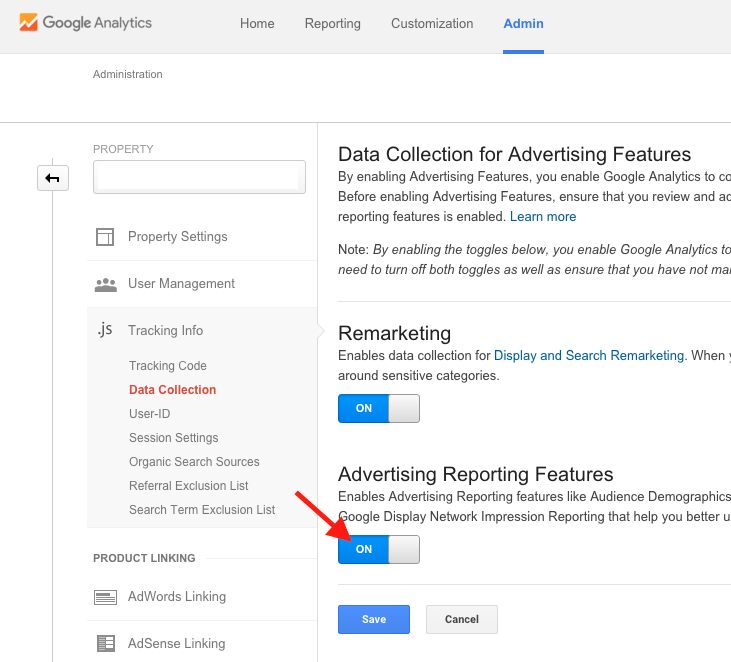
To see demographic information in Google Analytics, you’ll need to turn on one simple setting. Under the Admin section, go to Property Settings for your desired analytics property. Next, go to Data Collection under Tracking Info. Then, toggle the switch under Advertising Reporting Features on.
Now, you’ll be set up to collect demographic information about any users that come to your site, based on how Google has categorized those individuals from their activity across the web. Note that you won’t see any retroactive data, but you’ll see it build in the future. To comply with government guidelines, make sure you update your privacy policy, letting users know how you’re tracking them.
To view demographic data under Reporting, go to the Demographics section under Audience. The Demographics > Overview report will show you a top-level breakdown of age and gender categories by Session.
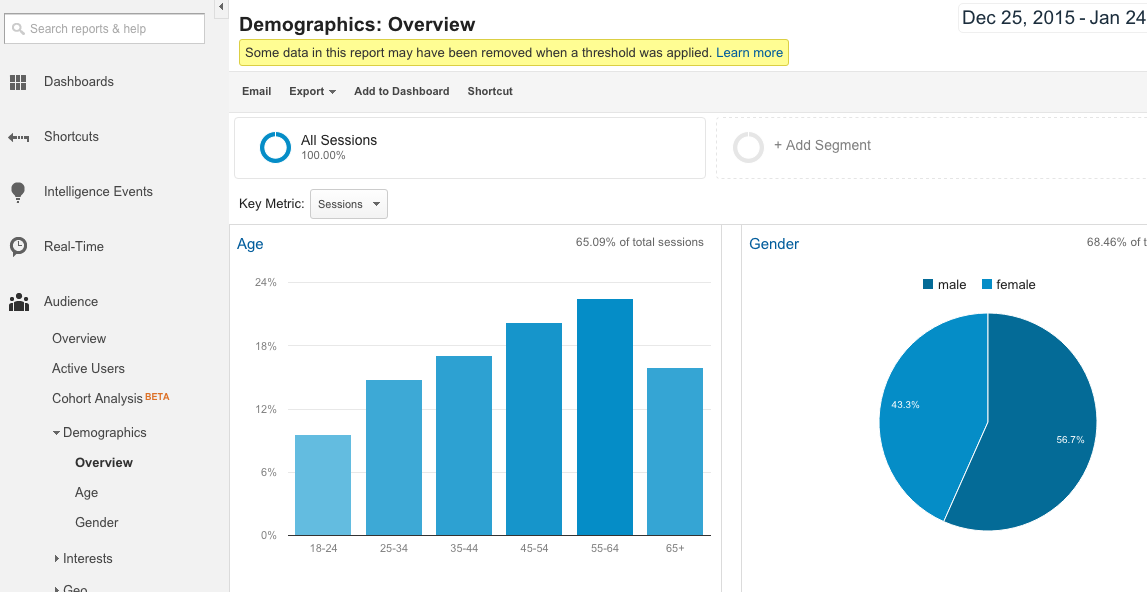
At a cursory look, the 55-64 age bracket makes up the largest category of people visiting the site, while gender skews slightly in favor of females. From this initial data, you could choose to specifically target 55-64, and possibly 45-54 (the next largest category) more heavily than other ages in Facebook advertising.
However, we’re just looking at total Sessions by age and gender here. We can do better than that! Let’s break down the data much more specifically to look at engagement and conversion data by category to better inform our future ad targeting.
Evaluating Conversion Data by Demographic
We’ll look at the Age report (Audience > Demographics > Age) to break down metrics on a deeper level. Here, we’ll opt to add a Secondary Dimension to allow us to look at categories by both age and gender. To do so, click the Secondary Dimension and choose Gender (note you can type in the search bar to find your desired dimension more quickly).
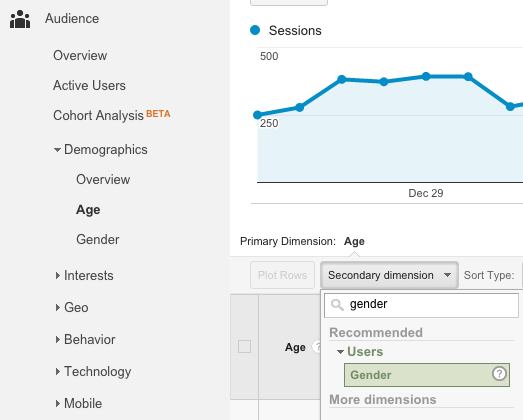
Once you’ve added this Dimension to your report, you’ll see your table update to include subcategories of Gender within the Age brackets. Now, we can compare a number of metrics for each category.
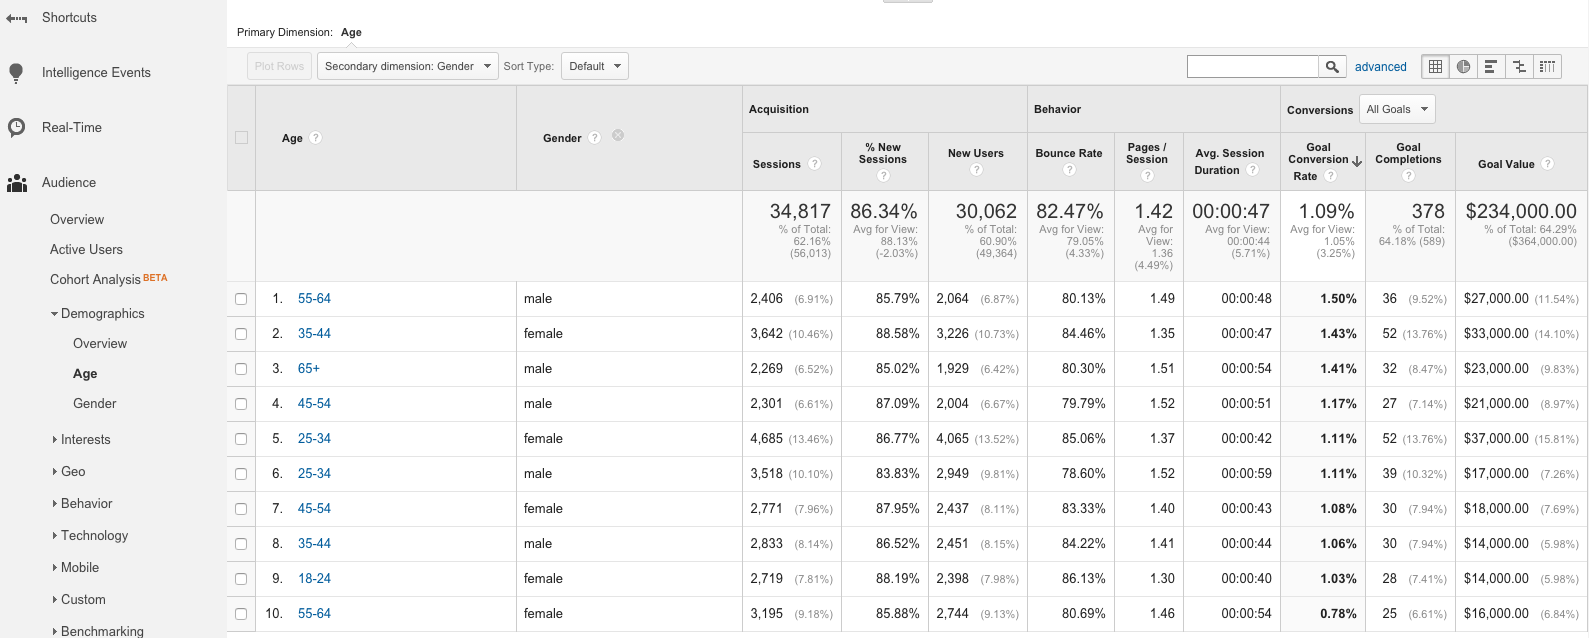
Here, we’ll sort by Goal Conversion Rate, looking at the likelihood of each category to submit a lead form on the site. As a result, we see males 55-64 are the most likely to convert. Close behind are females 35-44. We also note that females 35-44 and females 25-34 tie for the highest number of total Goal Completions, with females 25-34 having the highest Goal Value (an approximate value attached to each lead generated on the site).
Based on this data, each of these categories broken out above would be valuable to target in future Facebook advertising campaigns, segmenting by both age and gender to monitor performance for each.
Consider Engagement Data
If you’re promoting blog content and encouraging readership on your site, you’ll want to look at engagement data such as Avg. Session Duration and Pages/Session by category. This will allow you to analyze how likely people are to spend time on your site and look at multiple pages of content. Here is another site’s data, looking at the same report but sorted by Avg. Session Duration.
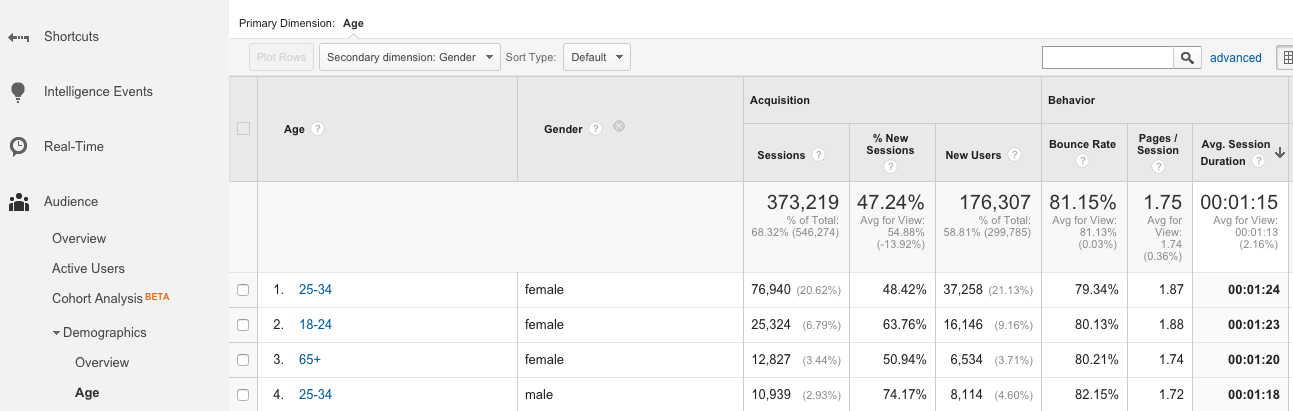
Here, we can see that females 25-34 and 18-24 barely edge out other categories with the longest time on site, as well as the most pages looked at in a Session. We can then focus on promoting content to individuals fitting these criteria.
Google Analytics Interests
Turning on demographic data tracking also enables logging of user interests, categories showing topics that users frequent across the web. These include general interests such as entertainment preferences, as well as in-market categories indicating that users are shopping for items such as new homes.
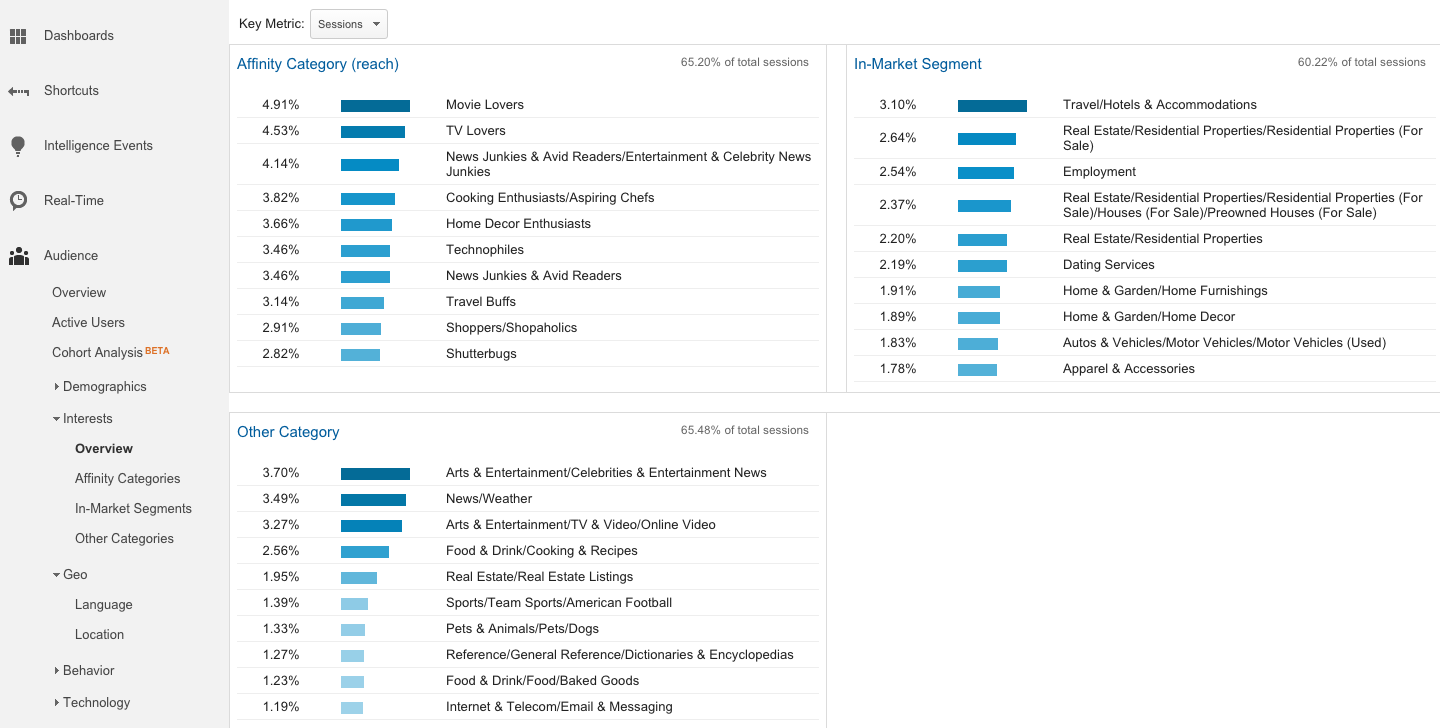
This data can help to inform possible interest targets in Facebook advertising that may not necessarily relate to the obvious factors you may think of. For instance, you may find that people who are researching both cooking and travel may be interested in articles about ethnic food which would guide your targeting to promote articles on that topic.
Geographic Targeting
Geography is often one of the most important criteria for reaching users likely to fit your target audience. Businesses serving a local audience may find that people from one zip code may be much more likely to purchase services, as opposed to the next town over.
Using the Geography reports in Google Analytics can help to guide how you geotarget Facebook ads. As an example, we’ll look at the Geo > Location report. We’ll drill down to City level within Florida (to do this, we simply click Florida on the map). Next, we’ll sort by Goal Completions to show the cities that have driven the most leads over the past year.
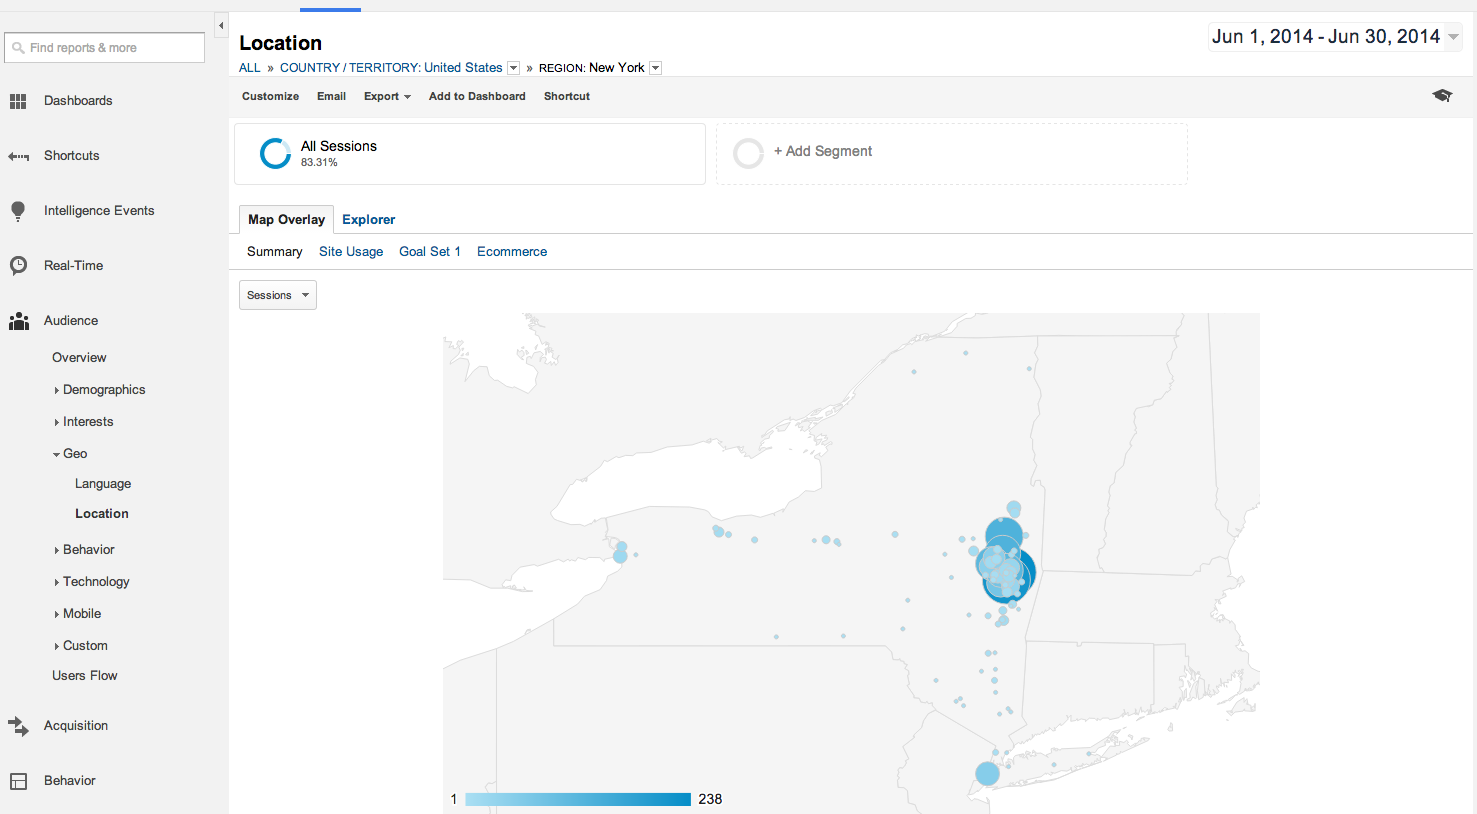
In this report, we can see that Cape Coral has by far driven the most lead submissions, followed by Fort Myers and Naples. Interestingly, we can also note that these aren’t necessary the towns with the highest Avg. Session Duration or Pages/Session, with other cities ranking higher for those metrics but having lower conversions. From this data, we can choose to focus on targeting Facebook content to users in the cities most likely to convert.

Conclusion
Google Analytics allows you to supplement the data you get from Facebook Advertising, learning about the people who engage with your website to target similar individuals elsewhere. You can find a number of factors that correlate with targeting criteria available in the Facebook ads platform, including age, gender, interests, and geography.
Be sure to review your Google Analytics data, both in planning to launch Facebook ads and in the process of refining them. Make sure you’re targeting the demographics who are most likely to spend time reading your content and, ultimately, to convert into leads and paying customers.

