
The Standard Cohort Analysis Report
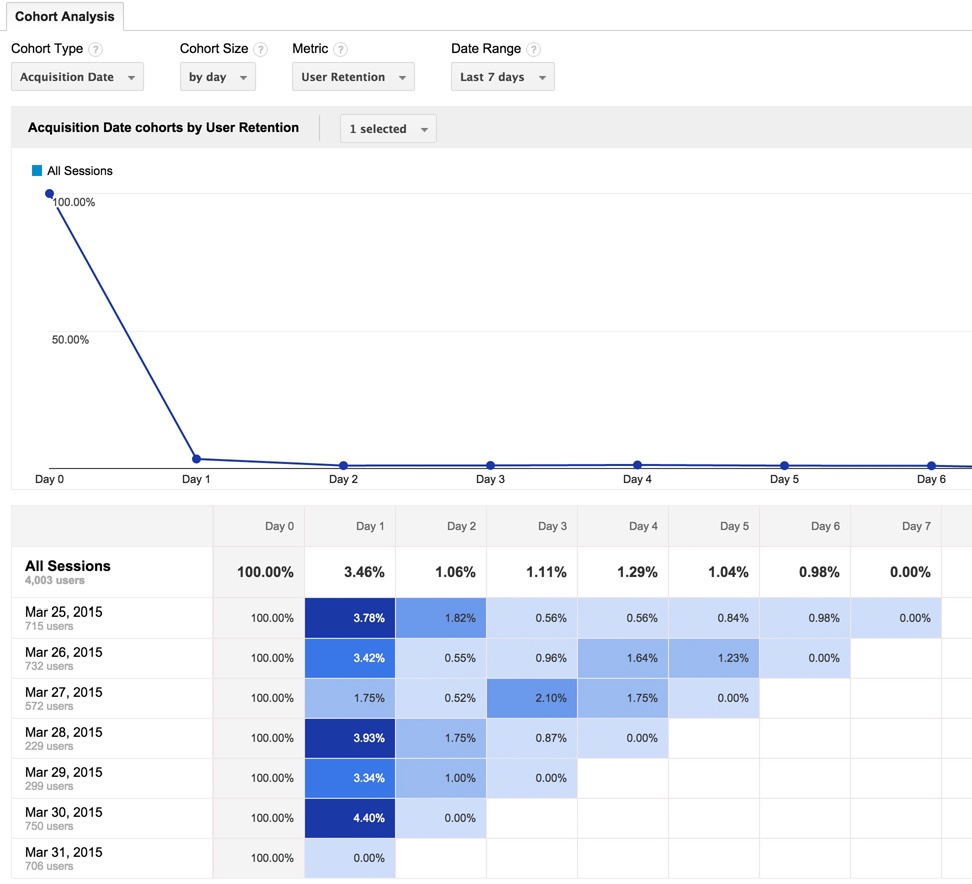
Below is the standard report from Audience > Cohort Analysis. Here, cohorts are defined by the day the user first visited the website (or app). So, in the example shown below, Google has defined cohorts for Mar 25 (users visiting for the first time on Mar 25), Mar 26 (users visiting for the first time on Mar 26), etc.
Notice that the report contains a line chart on top and a color-coded table chart beneath. By default, the User Retention metric is selected. This metric indicates which percentage of the cohort returned to the website (or app) in the subsequent periods. Since Day 0 is the day that defines the cohort, the User Retention is always 100% and trails off on subsequent days.
To understand the table, start at the top row – labeled Mar 25. Reading left to right across the columns, you see the Retention Rate for each subsequent day. For example, on Day 1, 3.78% of the Mar 25 cohort (first time visitors that day) came back to the website (or app). On Day 2, the percentage drops to 1.82%, etc. Dark squares in the chart show where the User Retention rate is relatively high. The last day in each row is today and it seems to always show 0% - probably because Google hasn’t processed the data yet – so we can just ignore that last cell in each row.
For a great introduction and overview of the Cohort Analysis report, see Understanding the Google Analytics Cohort Report by Justin Cutroni, or Using the New Cohort Analysis in Google Analytics by Sayf Sharif.
Evaluating Lead Generation with Google Analytics’ Cohort Analysis Report
Do our leads convert into customers?
If you are analyzing lead generation, that is the key question.
With cohort analysis, we can look at a group of leads and see how many converted into customers one day out, two days out, etc. We can do that by using the Transactions metric instead of the User Retention metric – this assumes you have Ecommerce set up on your website. If you don’t, you can still get a good idea of how many leads convert by looking at the User Retention metric. For example, if a lead is still coming back to your website one or two months after their first visit, then they are certainly a regular visitor and probably a customer.
In the example that follows, we are going to employ User Retention to analyze the lead generation for a B2B web-based business. Here, leads are identified by signing up for a free trial offer. The free trial lasts for two weeks. So, we can tell if a lead (a free trial user) has become a customer if they are continuing to come back to the website one or two months after trial signup. If they’re continuing to come back, they must have converted to a paid subscription.
Create a Segment for Analyzing Leads
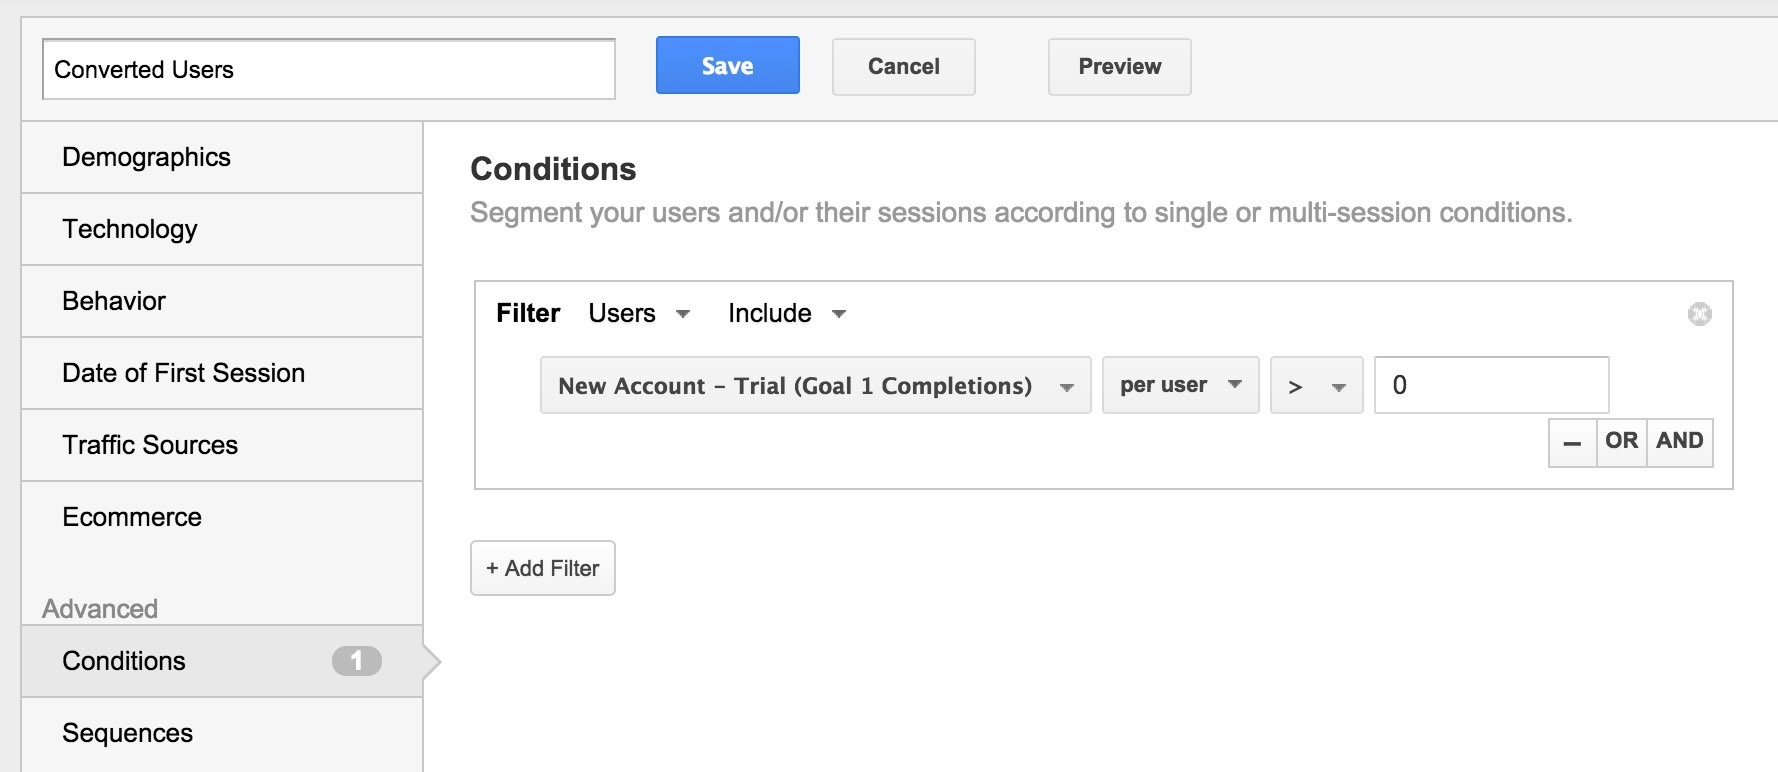
The first thing we want to do is create a segment for identifying leads. For this we use the Goal that the B2B company has set up that tracks when users sign up for the free trial. Below, you see the segment is defined to be Users that have completed the “New Account – Trial” Goal.
Now, let’s apply this segment to the Cohort Analysis report and adjust the cohort size to month and date range to last three months.
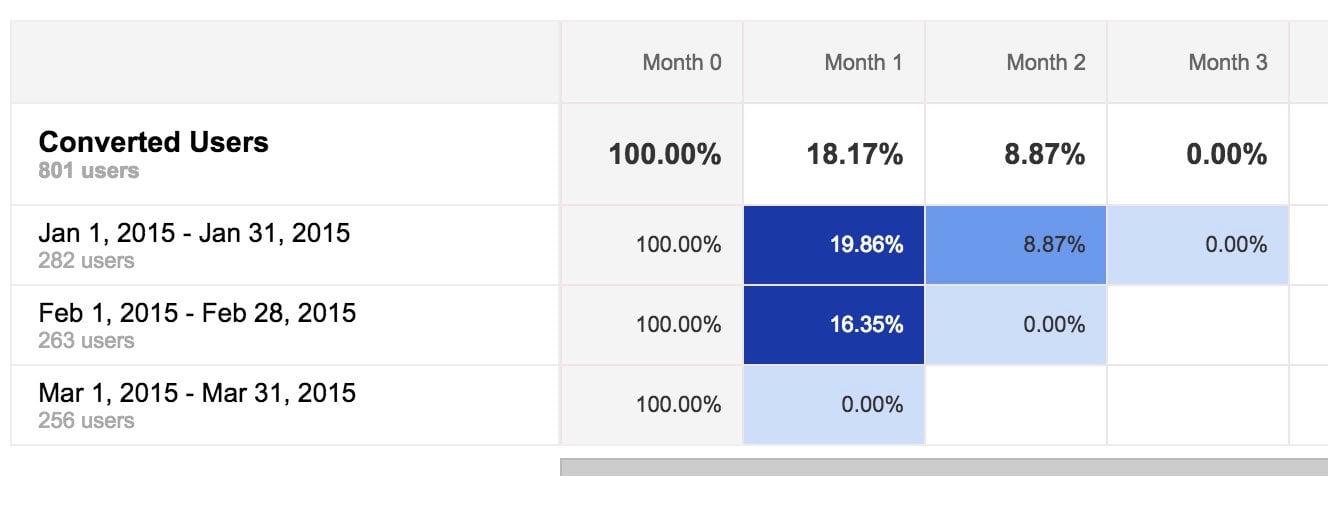
Notice Month 2 for the January cohort. It says that 8.87% of the leads from January are still coming to the website in March. Since we know their 14-day trials have expired, these are most likely to be customers. (Note: Month 3 is April and since I generated this chart on April 1st, there was no data showing up there yet).
Unfortunately, the Cohort Analysis report doesn’t go back further than three months, so this is all the data we have. But, as we draw near the end of April, it will be interesting to see if this company’s conversion rate from lead to customer in February stays around 8.87%.
Analyzing Conversion Rates by Channel
The Cohort Analysis report can give us some good insight into our lead to customer conversion rate. But we can get even more insight by segmenting our leads further. For example, we can segment the leads by Acquisition Channel to see where the best conversion rates are.
To do so, we’ll add another filter onto the lead filter shown above to create a segment that identifies those who first found the website via Organic Search.
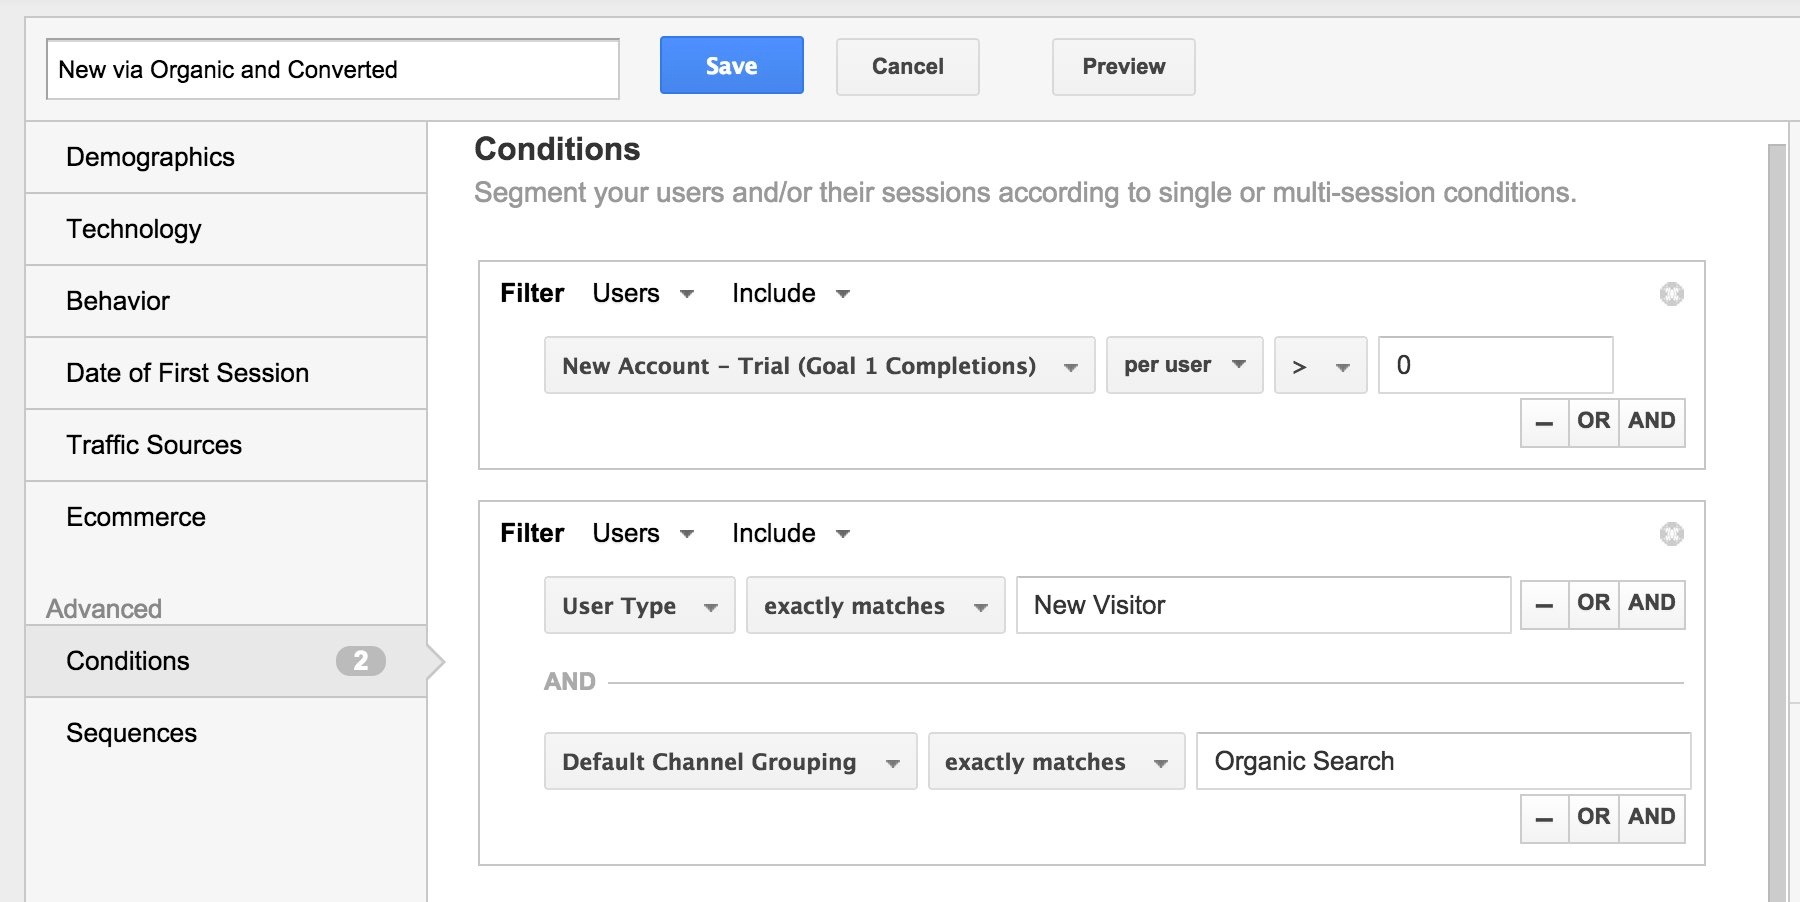
In the above segment definition, the first filter is the same that we used before to define leads. The second filter restricts the leads to those Users that arrived for the first time from Organic Search. That is, they were New Visitors (their first Session) via an Organic Search.
Having done this, we can create similar segments for the other channels. For the B2B company we are looking at, most leads come from Organic Search, Paid Search or Referrals, so we have created segments for those channels and applied them to the Cohort Analysis report.
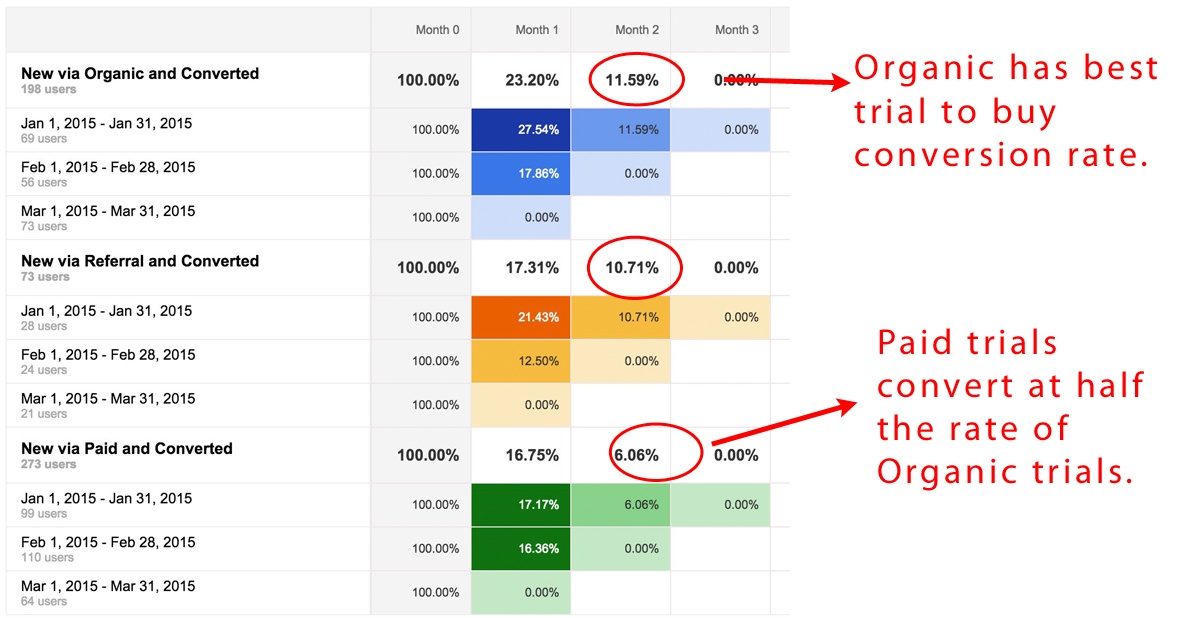
With these three segments applied, Google Analytics shows us the cohort performance for each segment in the same table – using different colors. Organic Search is blue, Referrals are Orange and Paid Search is green. This is a pretty slick and useful visualization, and we immediately get some powerful insights.
Organic leads converted to customers at 11.59% - far higher than the average of 8.87% we just saw. Referrals, at 10.71%, also beat the average. And Paid Search came in at 6.06% - a conversion rate that is almost half of that for Organic Search.
This analysis clearly shows that Organic Search is producing the highest quality leads for the B2B business. As a result, the company may want to shift resources away from Paid Search and over to the Organic and Referral channels.
Conclusion
Google Analytics’ Cohort Analysis report helps you to understand the subsequent behavior of users after they first land on your site. If you are doing lead generation, and your leads take days or weeks to convert, cohort analysis can help you understand which marketing techniques are generating leads that convert down the road. In this post, we used segments to look at the quality of leads by Acquisition Channel, but the same approach can be used to evaluate the effectiveness across a group of Campaigns.

