 Creating such a report from scratch for each client can be a time-consuming and intimidating task. Fortunately, Megalytic provides a simple interface for creating Google Ads report templates. Creating this template provides your agency with a starting point for future reports. For each new client, you can begin with the template and customize it to create an Ads report meeting the specific needs of that client.
Start Off with KPIs
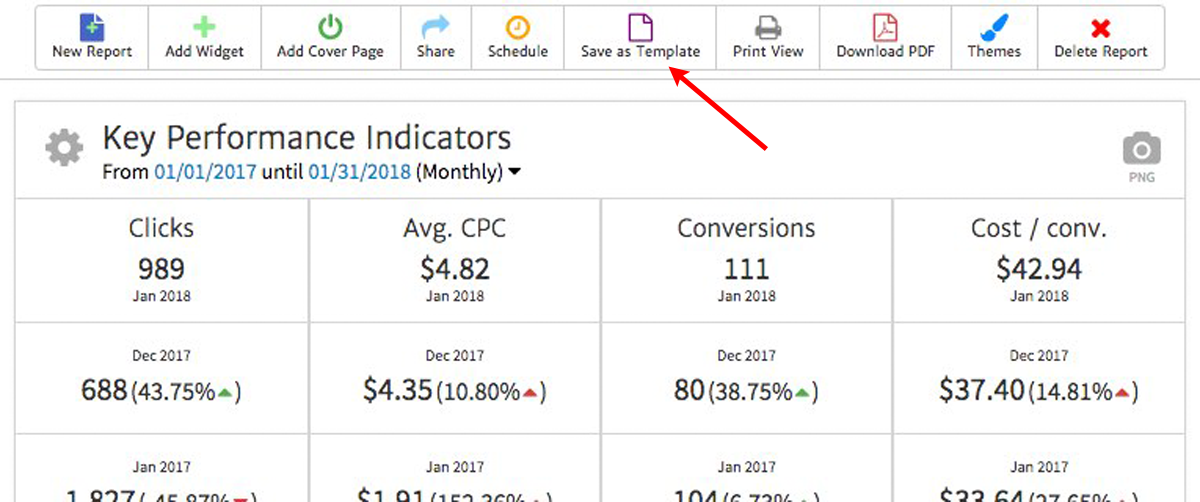
Begin your report with KPIs (key performance indicators) that summarize the performance of the client's Ads account at a glance. In Megalytic, the Google Ads Multi-KPI Widget enables you to display up to four metrics across the top and compare performance with previous time periods. Clients like to have the date comparisons so they can measure month-over-month and year-over-year performance.
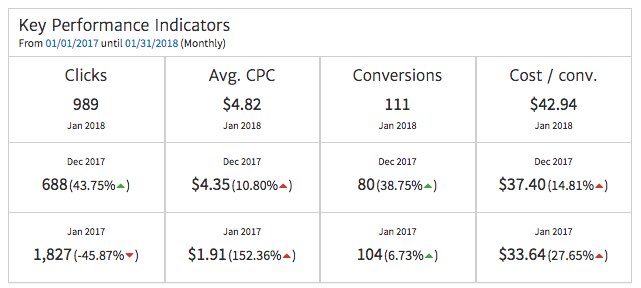
This example shows the client's metrics for January 2018 compared with last month (December 2017) and a year ago (January 2017). Here you can see that conversions are up 38.75% from last month (111 vs 90) and 6.73% vs year-ago (111 vs 104). However, the cost per conversion has gone up a lot and the number of clicks has gone way down.
[BTW: If you want to follow along and create a report like this for a client or prospective client, they will first need to share their Google Ads access with your agency.]
Widgets like these are highly customizable, so you can tailor the presentation of data to meet the specific needs of your agency. For a quick summary of how to do these customizations and save the results to a template, watch this video.
Use Notes to Provide Explanations
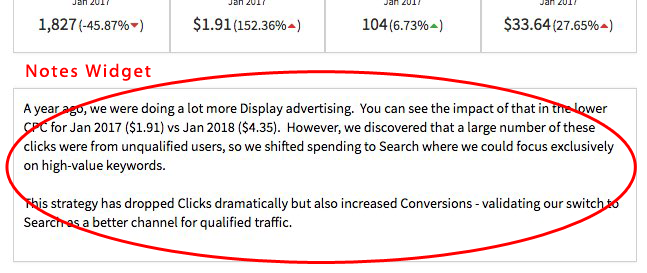
It's a good idea to meet with your client each month to review the performance of their Google Ads account. Their report, however, should be delivered prior to the meeting. To help your client understand the trends and strategy behind the numbers being reported, you can include text annotations in your report. Megalytic provides the Notes Widget for this purpose. Here is a note being used to explain the KPI widget example above.
KPIs for Campaign Level Data
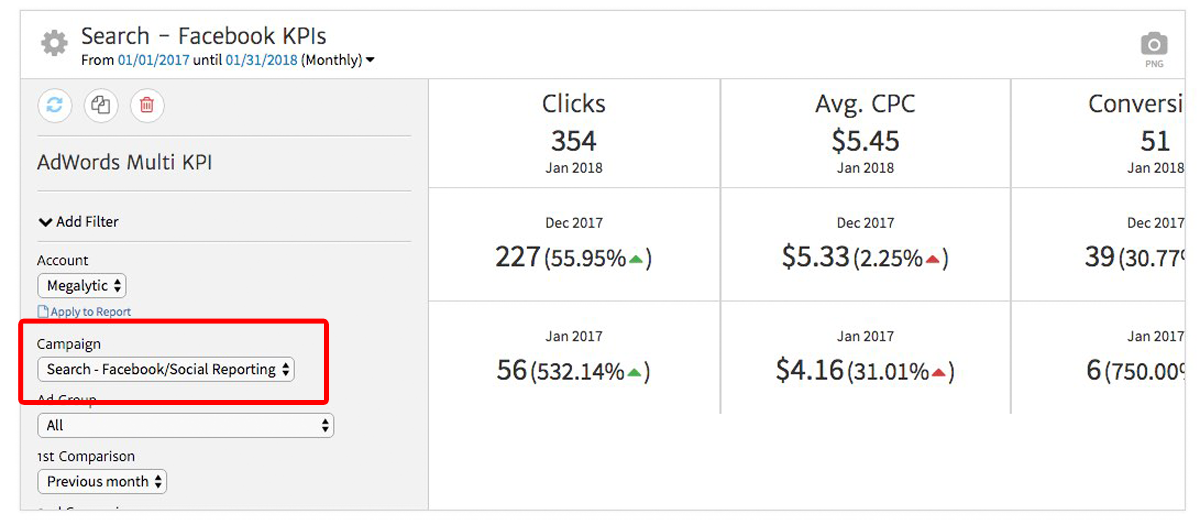
In addition to account level KPIs, your client may also want to see KPIs at the campaign level. To do this, you can use the same Multi-KPI widget, but with a specific campaign selected.
Here, the campaign "Search - Facebook/Social Reporting" has been selected from within the widget editor. The metrics displayed (e.g., Clicks, Avg. CPC, Conversions, Cost / conv.) now reflect the performance of this single campaign.
KPI Trends
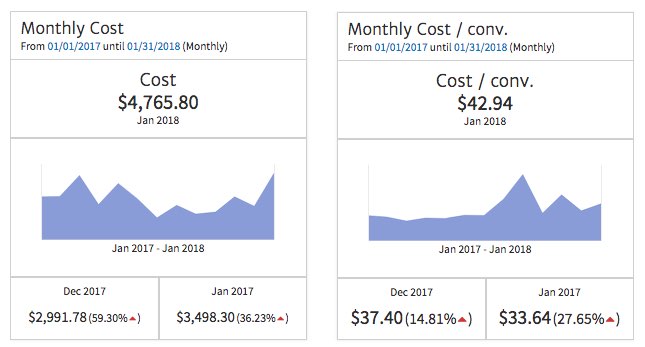
For some KPIs, your client may also want to see trends. Cost (i.e Spend) and Cost/conv. are typical examples of metrics where it is helpful to see how the values are moving over time. For this purpose, Megalytic provides single KPI widgets that provide a view of a single metric, along with date comparisons and a sparkline chart.
For this client, these two KPIs show a Cost that has been relatively flat over the last 12 months (but with a spike this January), and a Cost / conv. that jumped up mid-year. The increasing Cost/conv. reflects additional competition entering the marketplace mid-year.
KPIs for All Campaigns
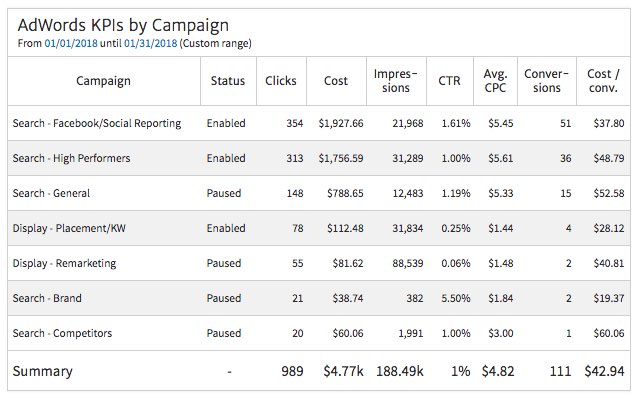
Rounding out the KPI section of your report, many clients like to see a summary of the KPIs for all the campaigns. In this type of table, you may also want to include a column showing the Status (i.e., Enabled, Paused, Stopped) for each campaign, so the client can tell which ones are currently running.
This type of table does not include any time period comparisons, but instead shows a variety of important metrics (e.g., Clicks, Cost, Impressions, CTR, Avg. CPC, Conversions, Cost/conv.). At a glance, your client can tell which campaigns are performing the best and which might need further optimization.
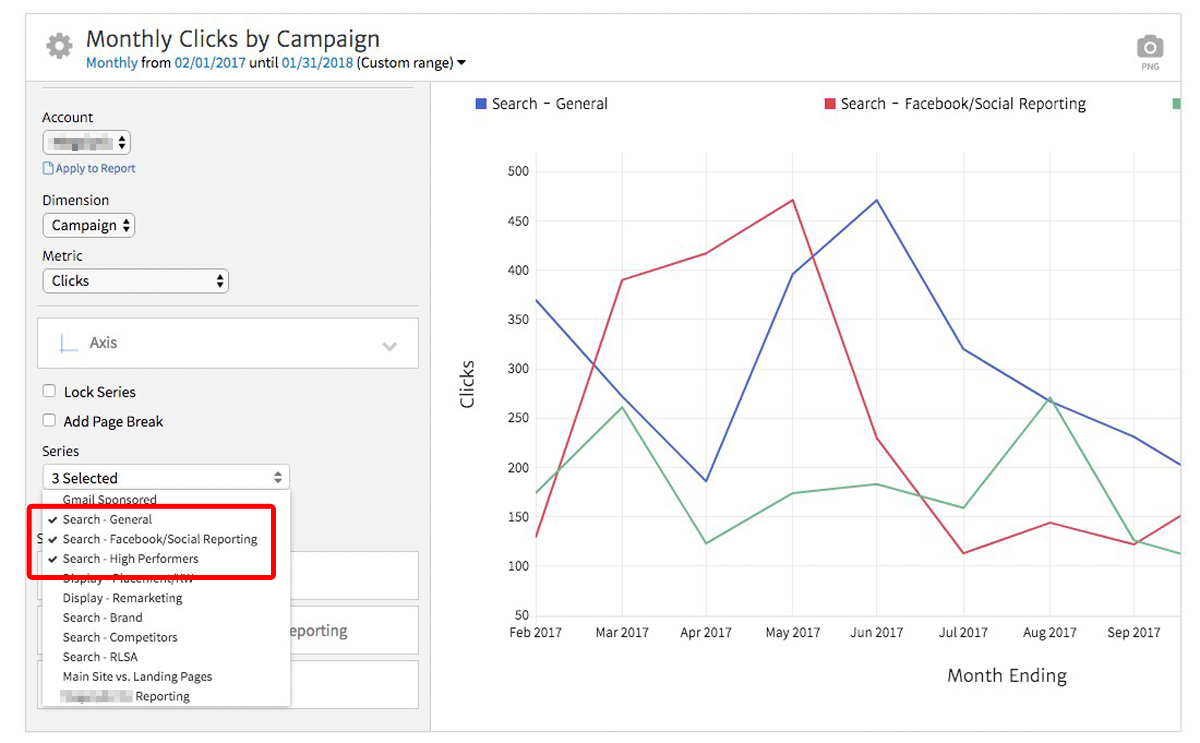
Some clients might also like to see KPI performance by Campaign over time - like the last 12 months. As shown below, you can add a time-series chart to your report template and select the campaigns that you would like to display. You can also select the metric (in this case Clicks).
Top Performing Keywords
Clients also usually like to examine the performance of the keywords you are bidding on - particularly the top performing keywords. With Megalytic, you can easily create a table showing the top keywords sorted by Clicks (or whatever metric you like).
Along with Clicks, its a good idea to provide a selection of other important metrics. Here, we have selected Avg. CPC, Quality Score, All conv. (conversions), Cost / conv., and Search Impr. share. Notice that the Keyword column also includes (optionally) the Campaign and Ad Group information.
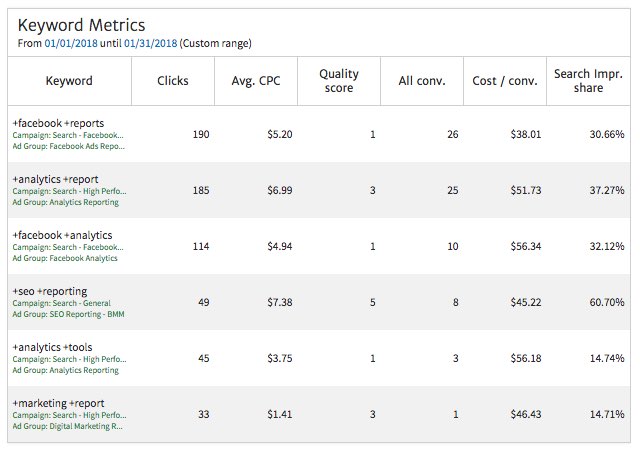
Here we have defined "Top Keywords" in terms of Clicks. So these are the keywords sending the most traffic to our landing pages. But, depending on your client's goals, you might want to focus on another metric to define the top keywords. Cost/conv. is a popular choice (with lower being better). In Megalytic, you can tweak this table to make Cost/conv. the first column, and sort on it.
Month over Month Comparison for Keywords
In addition to reporting keyword performance during the previous month, you should also show your clients how this month's results compare with last month. For example, this table shows where spending has increased/decreased, by keyword, since last month.
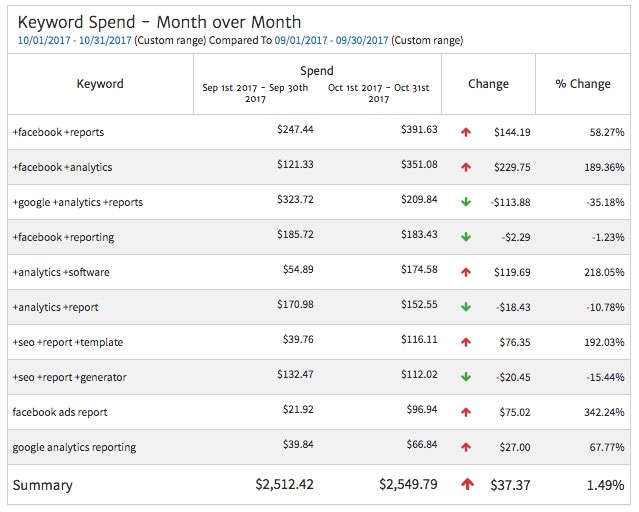
Notice that in this table we have removed the Campaign and Ad Group information. Some clients will prefer this less cluttered look. Others will like the additional information.
Search vs Display Networks
If you are doing both Search and Display Network advertising for your client, it makes sense to provide a summary of where the traffic is coming from. Here, we show the monthly trend in Clicks from Search vs Display. You can see that we started out investing more heavily in Display, but over time have shifted focus to the Search Network.
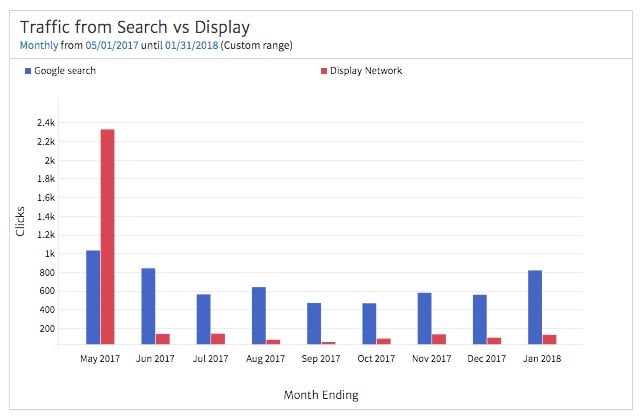
Here, we are showing the Search and Display Networks, but you should include all those where your Client is advertising, such as YouTube Videos or Search Partners.
Google Ads Performance by Device
Lastly, you should include some data showing the relative performance of your client's ads across devices. While mobile grabs an increasing share of overall traffic, that doesn't necessarily mean that mobile is the most important device category for your client's ads. That's going to depend on your client's product and how the client's customers like to engage.
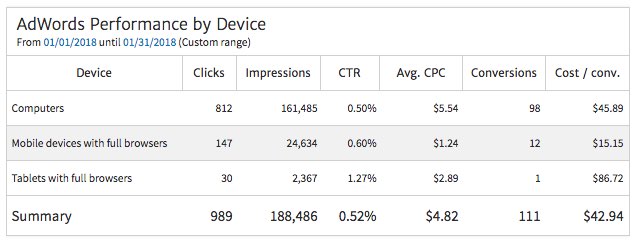
This table shows performance across a set of key metrics. You'll notice that while Computers are generating the most Clicks, they have a lower CTR and a much higher Cost / conv. In this case, it is worth a discussion with the client about whether they would like to shift spending to mobile.
Finalizing and Saving Your Template
Continue adding widgets until you have communicated the important information. Make sure to include statistics showing both the big picture perspective and the important details your client cares about. You will need to use your judgement to decide how many widgets to include. Some clients love tons of data, and others just want to see a few KPIs.
Since you are creating a template, it is probably best to err on the side of too much data. You can always delete widgets from reports for individual clients. That way, the clients that crave data can get the full picture, for and those that want a short summary you can remove a lot of the detail.
Once you are satisfied with the widgets, save your template for future use. To do this, simply click the “Save as Template” button right above your report in Megalytic.
Give your report a name, a description (optional), save it, and you’re ready to access it whenever you build your next Google Ads report.
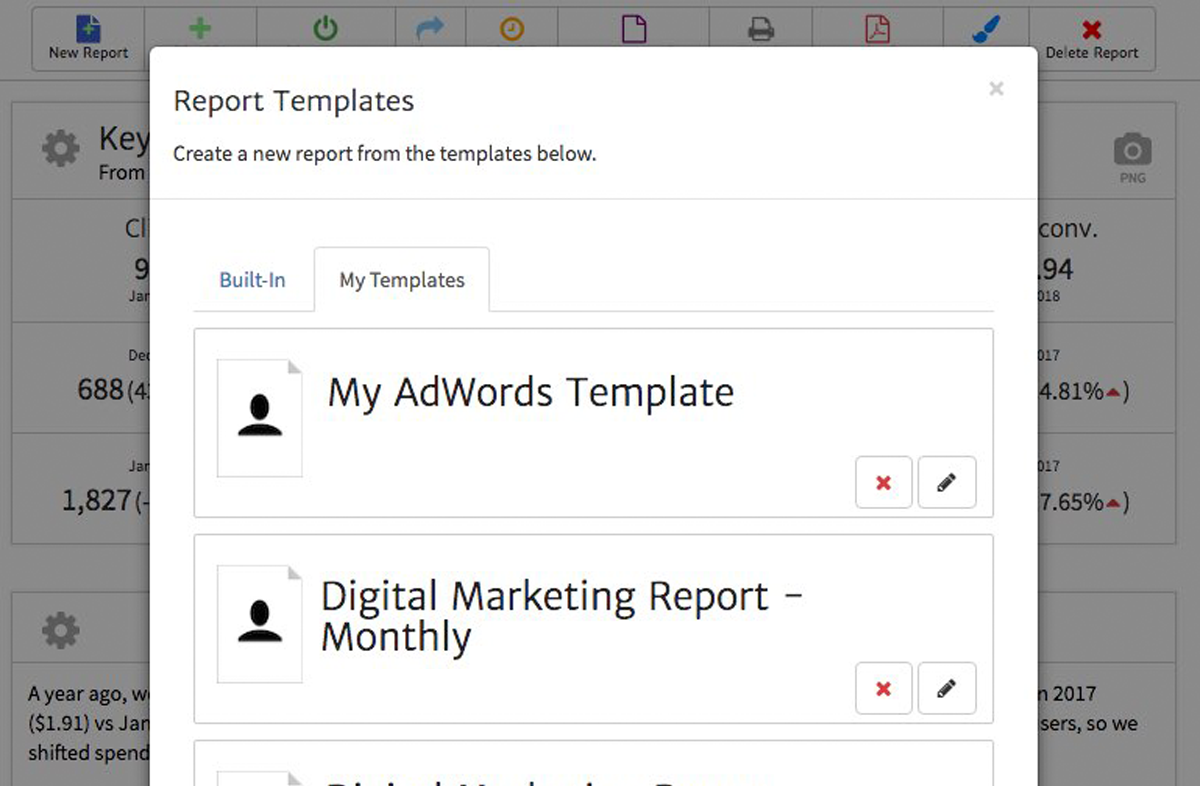
To use an existing template, create a new report and select the My Templates tab. You’ll then see a list of your custom-built templates where you can choose the one you wish to use. The one we just created is shown below as "My AdWords Template".
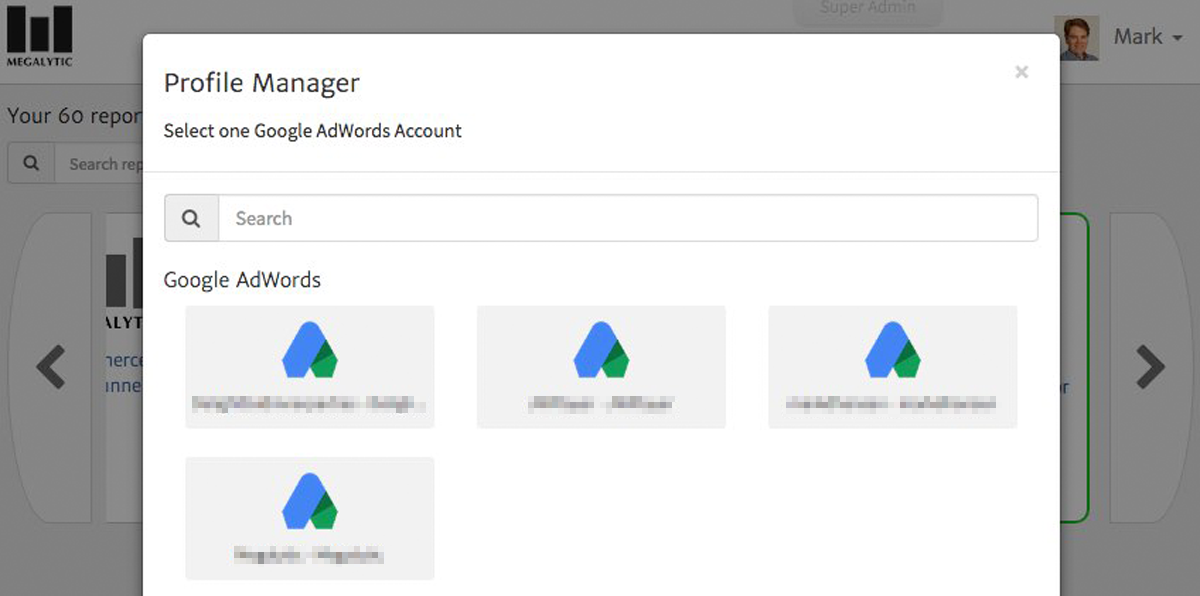
After you select the template, the next step is to choose the Google Ads account for generating the report. Megalytic will show you all the Google Ads accounts you have connected. Pick one, and the template will be populated with data from that account to create the report.
Once you’ve created a report with a template, you can modify the date range, edit widgets, and includes notes as needed for your client.
Conclusion
Building a template for your agency's Google Ads report will jumpstart reporting for all your Ads clients. The template you create provides a starting point for building individualized reports for each client by automating all the repetitive work. While you should not rely solely on the same template for every client, save time by creating a template with stats that you know you will need, and move forward to customize the report to communicate the most important information to each individual client.

