
May 20, 2024
PPC industry terms and acronyms can seem like a foreign language to those not managing digital media.
It’s important to translate how performance metrics impact overall business goals. Slim your reports down to the key metrics that matter, and explain trends in common terms.
Report on PPC Metrics in Common Business Terms
Clicks
From an outsider clicks don't seem all that valuable. Is it unique clicks? Clicks to what exactly? Describe these are active searchers, who were looking for your industry, product, or service and were interested to learn more.
Use instead: Web Visitors
Cost
This indicates the total amount of money the company owes for running ads. But, what is it in relation to? The C-suite allots budgets to departments based on performance and goals. How does this expenditure relate to your monthly/ quarterly/yearly budget?
Use instead: Budget spent or spend
Conversions
This is a broad universal term used for when a goal is achieved. How is a conversion defined in your business? Replace the word conversion with your objective:
- Lead generation for sales
- Email address capture
- E-commerce purchase
Use instead: Lead, sign-up, or purchase
Cost Per Conversion
Is this relative cost high or low? Some conversions are worth thousands, others worth a few dollars. Use a more descriptive term to easily gauge value.
Use instead: Cost per lead, cost per form fill, or cost per sale.
Return On Ad Spend (ROAS)
This formula reveals the net revenue gained from your ad campaigns.
ROAS = (Revenue – Cost) / Cost
Use instead: Return on investment (ROI)
This is how your CEO/CFO reports company health to the company, board, or investors. Don’t just provide the percentage – also include a ratio. Ex: 300% ROI. Or, a 3:1 return. Currently, every $1 spent is yielding $3 in return on average.
Tips for a Good MonthlyReport
1. Provide a highlight summary at the top
- Include bullets on performance trends of the most important metrics.
- Sum up performance across channels, accounts, and campaigns.
- Include next action steps.
2. Visualize performance trends in graphs
Your CFO and you might love seeing all the raw data, but for others, it’s time consuming and hard to draw conclusions.
Appeal to visual learners by showcasing a slice of data within a graph, chart, or table. Use a PPC reporting tool to help automate the visualization creation.
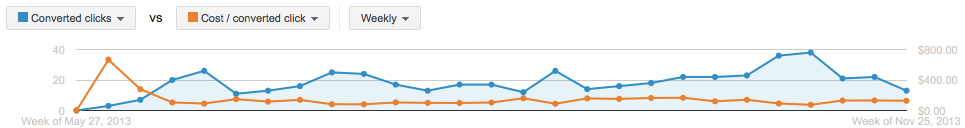
Provide additional context with the graph.
Example: Within this graph, you can see that total lead volumes have been increasing (total conversions), while the average cost per lead (cost per conversion) has been declining since May.
3. Explain how your results impact the business as a whole

Include other department insights or metrics if available. Examples:
Goal: Lead Generation
Over the past 3 months we generated 95 additional leads on the same budget, compared to the last quarter. This has translated into 60 additional sales demos ran, netting 15 new sales, totaling $105,000 in new revenue.
Goal: E-commerce
The warehouse manager noted there is a large stock of chainsaw inventory sitting in the warehouse for months. We created new chainsaw campaigns with promo discount pricing to move more products. The campaign sold 65% of the overstocked inventory, netting $85,000 in revenue — spending just $35,000 of our total monthly budget.
Wrap Up
Remember, the executive team often is faced with making complex decisions with limited time. Whittle your report down to the essential viewpoints they can understand quickly. Finally, explain how paid media initiatives are aiding the company's top line growth and net profits.
![]()
