
May 20, 2024
Megalytic Introduces Bing Ads Integration
By Megalytic Staff - August 08, 2018
Connecting a Megalytic Account to Bing Ads
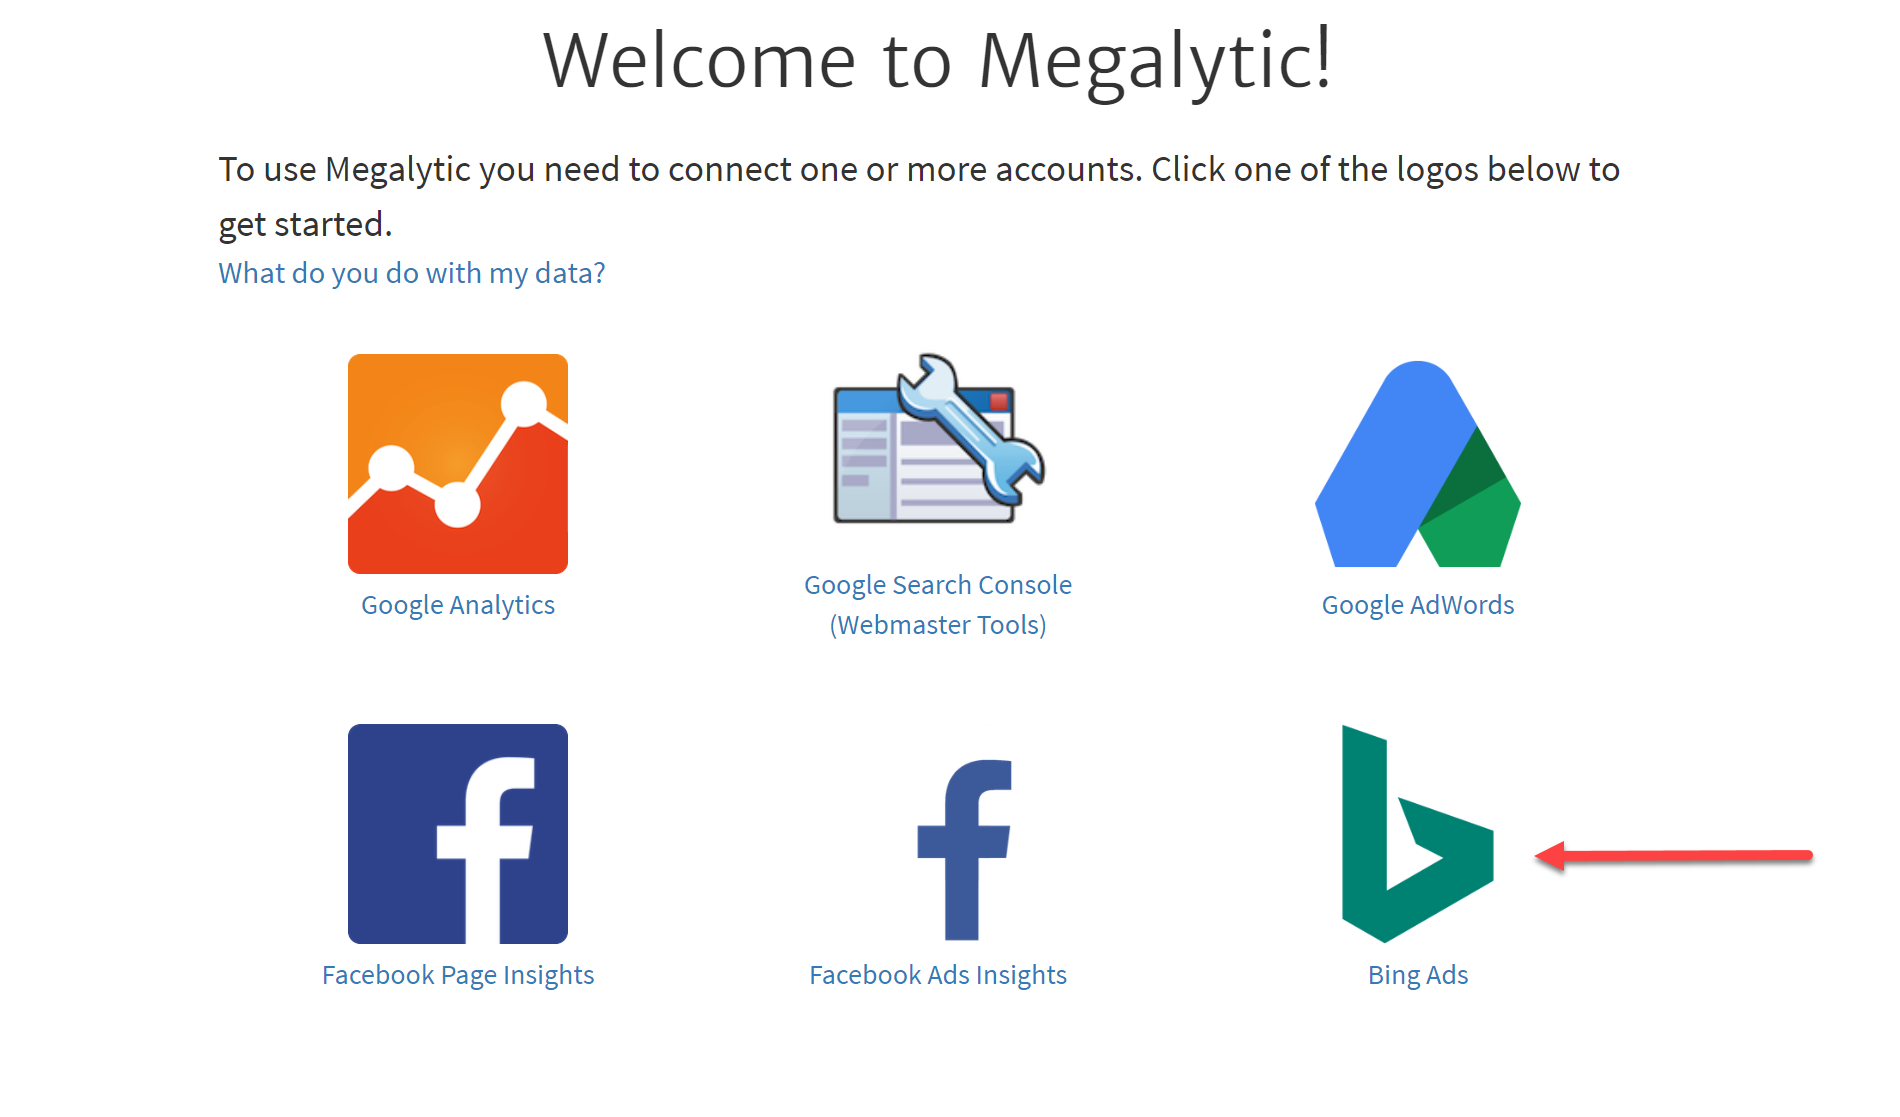
If you don’t already have a Megalytic account, you can sign up for a 14-day free trial (no credit card required) and start using all the features. Once you create your account, you will be asked to connect with a data source in order to create your first report. Select Bing Ads.
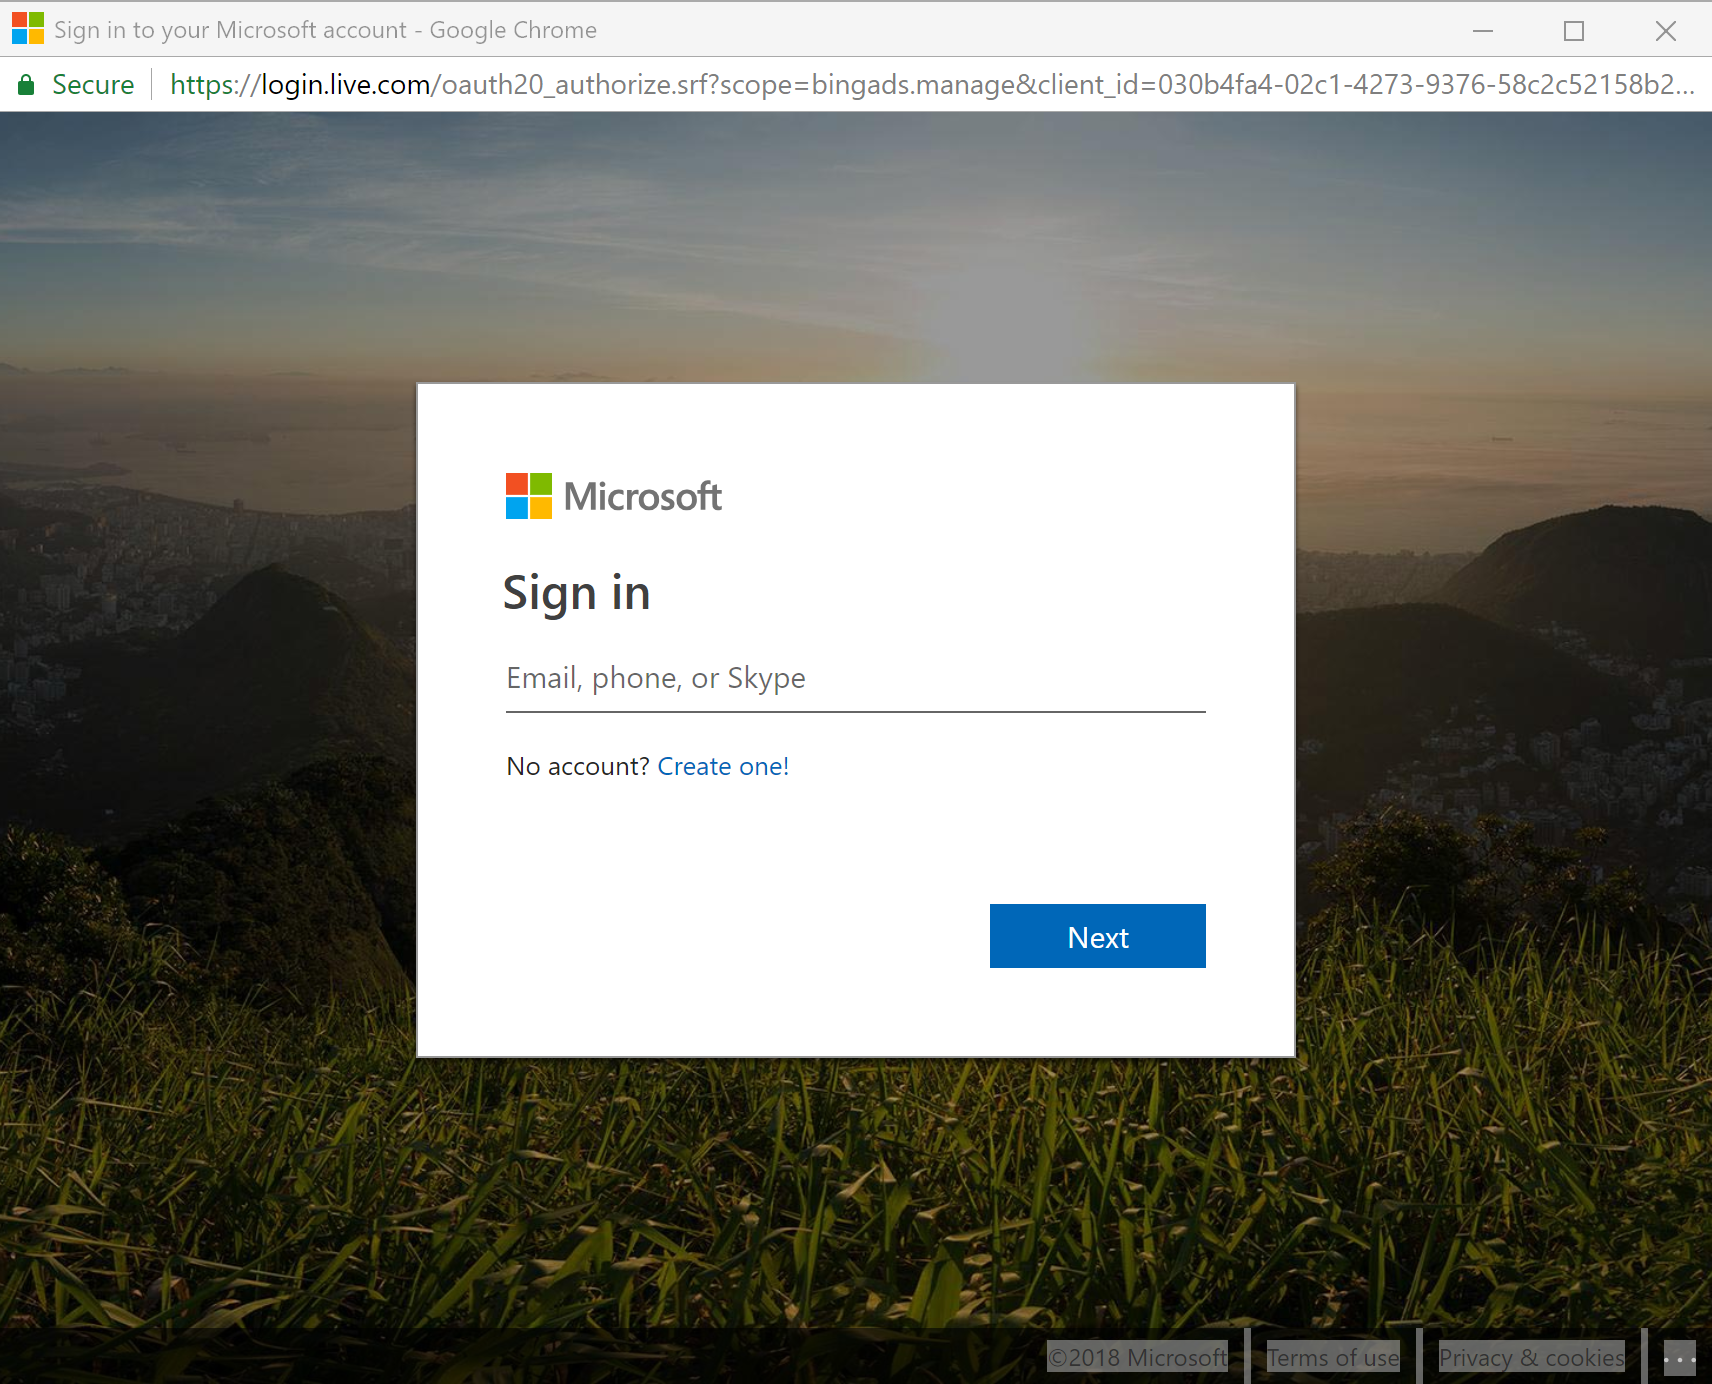
Next, you will be asked to sign in to a Microsoft account. Sign in to the account that you use for creating and running Bing Ads.
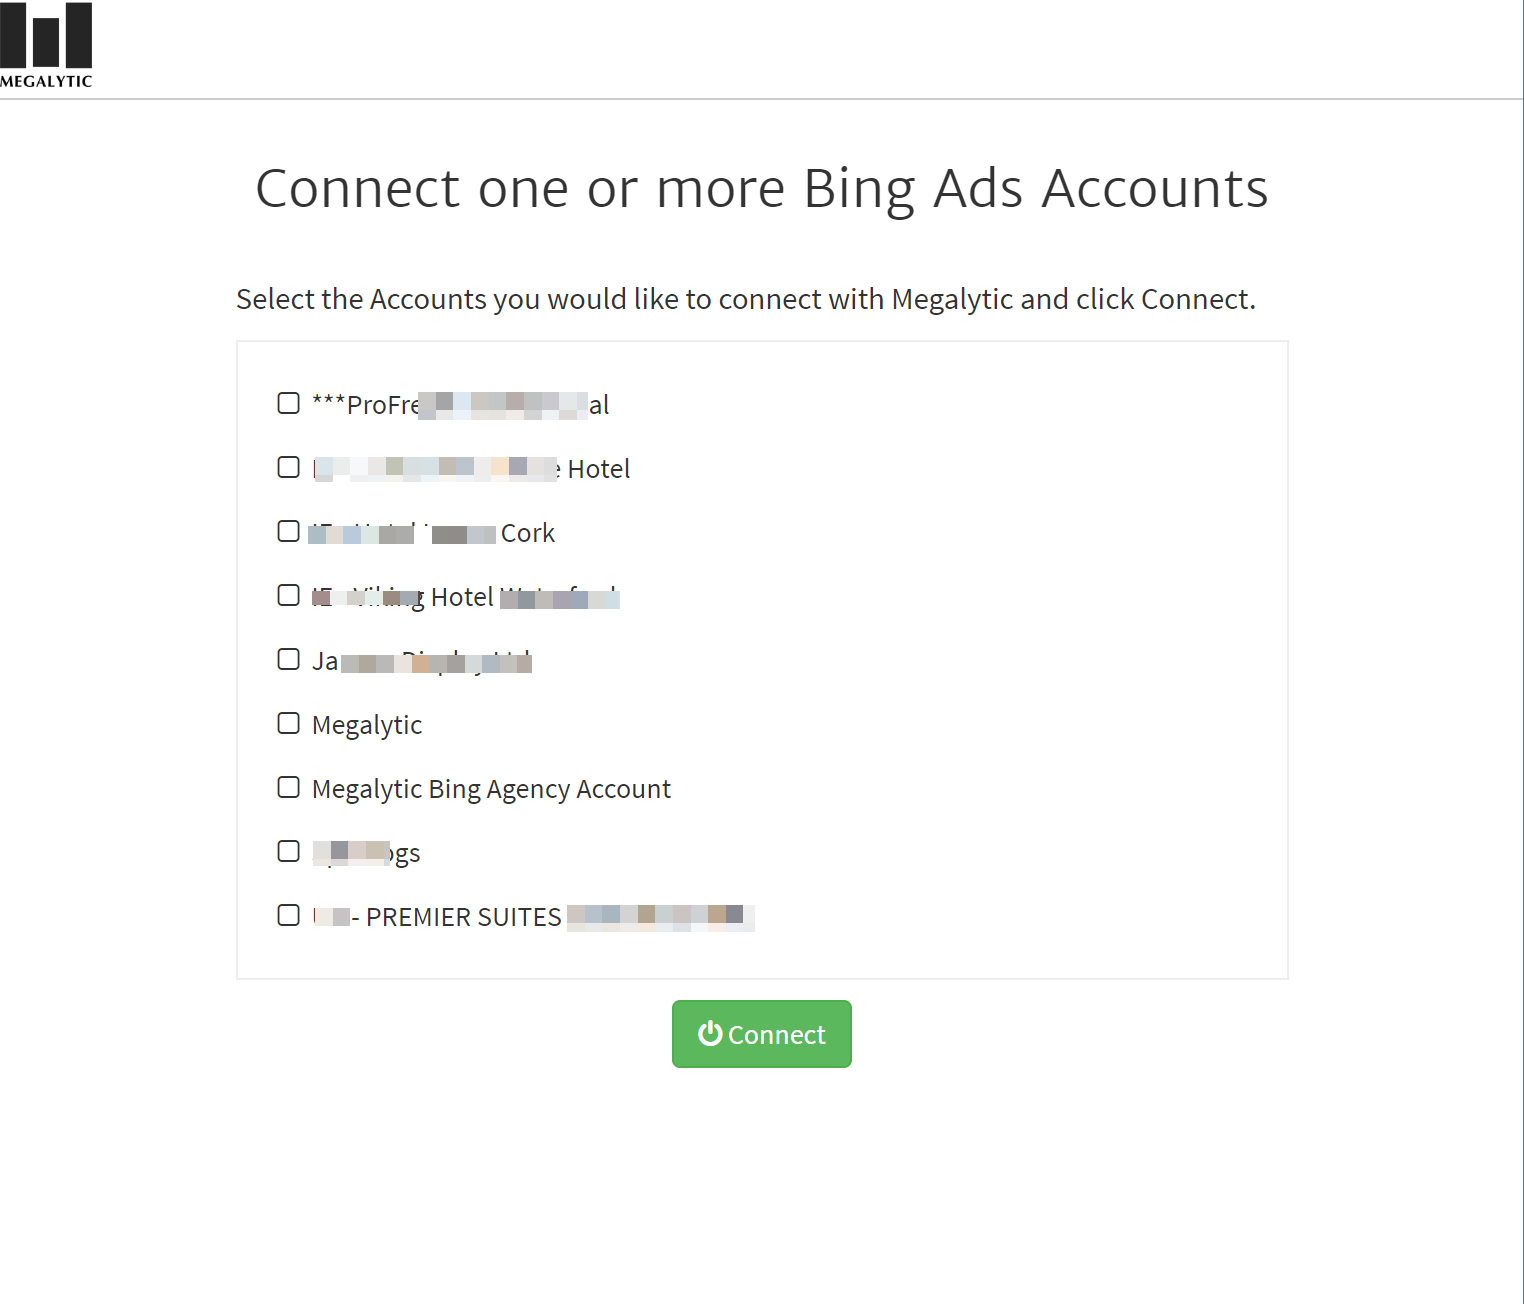
Once you have signed in to your account, you will be presented with a list of the Bing Ads accounts that you are authorized to access. Pick one or more to connect with Megalytic.
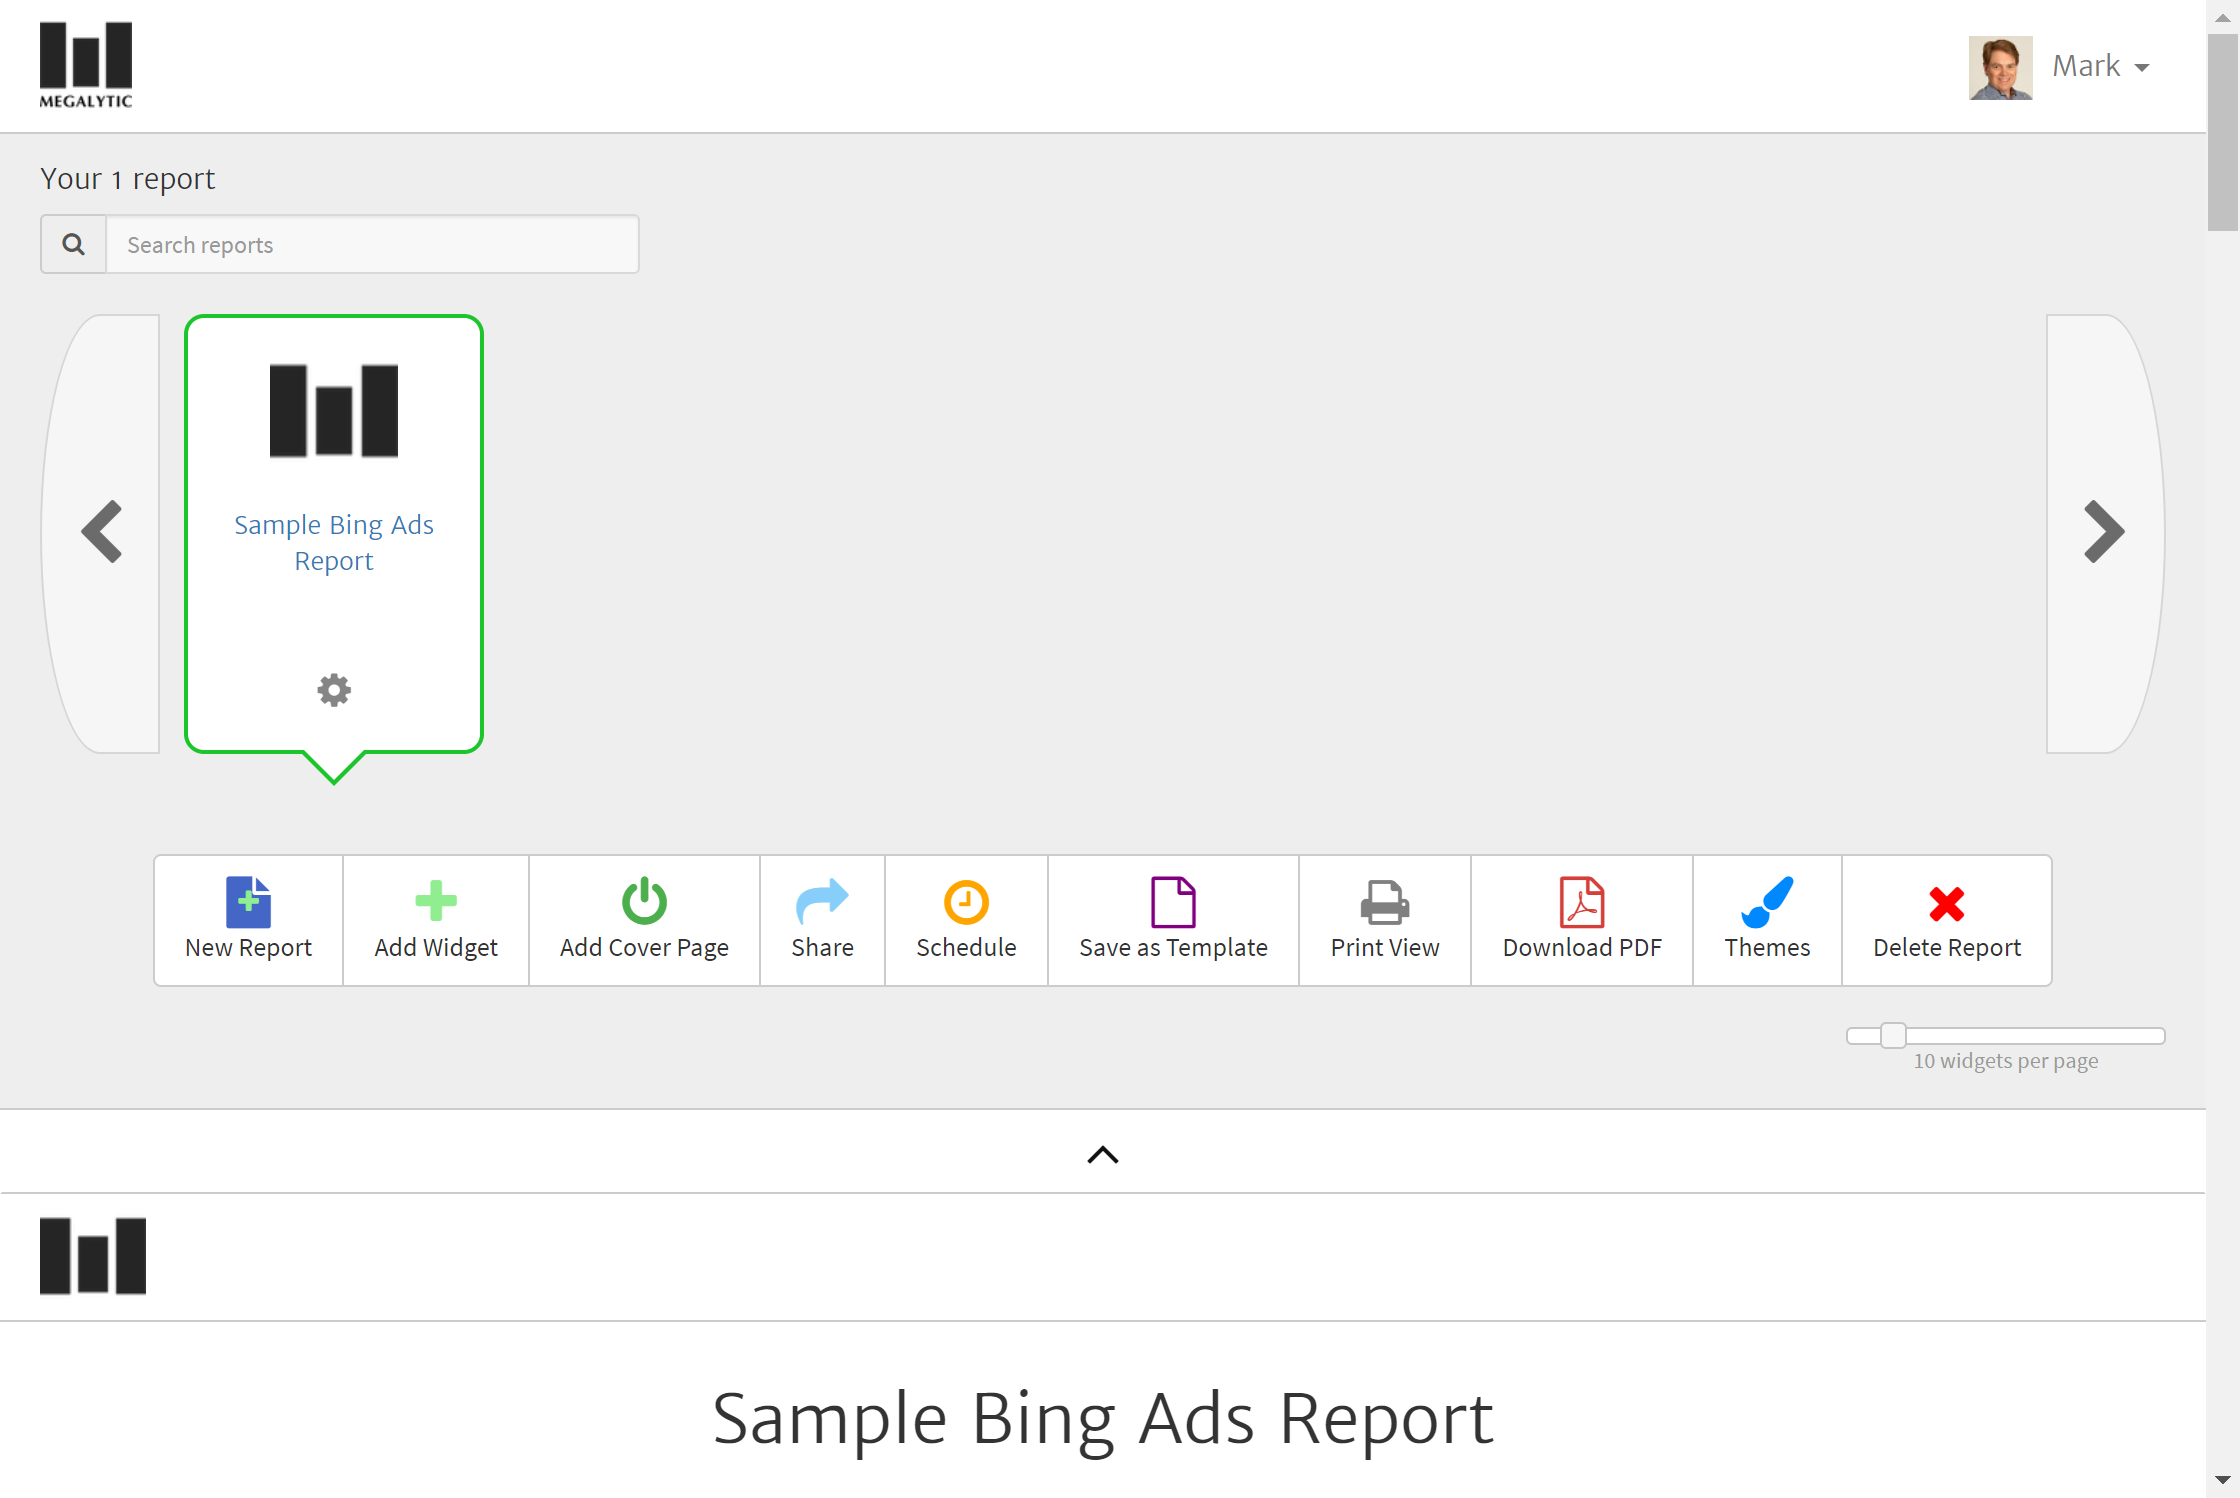
When your Bing Ads account has been connected, Megalytic generates your first Bing Ads report from a template. Click on the button that says "View Your Report" and Megalytic will open your report where you can view the data and make any edits that you need. In your Megalytic workspace, the report will be titled "Sample Bing Ads Report".
We can explore this report and learn a little bit about Megalytic's Bing Ads reporting features.
Exploring and Customizing a Bing Ads Report
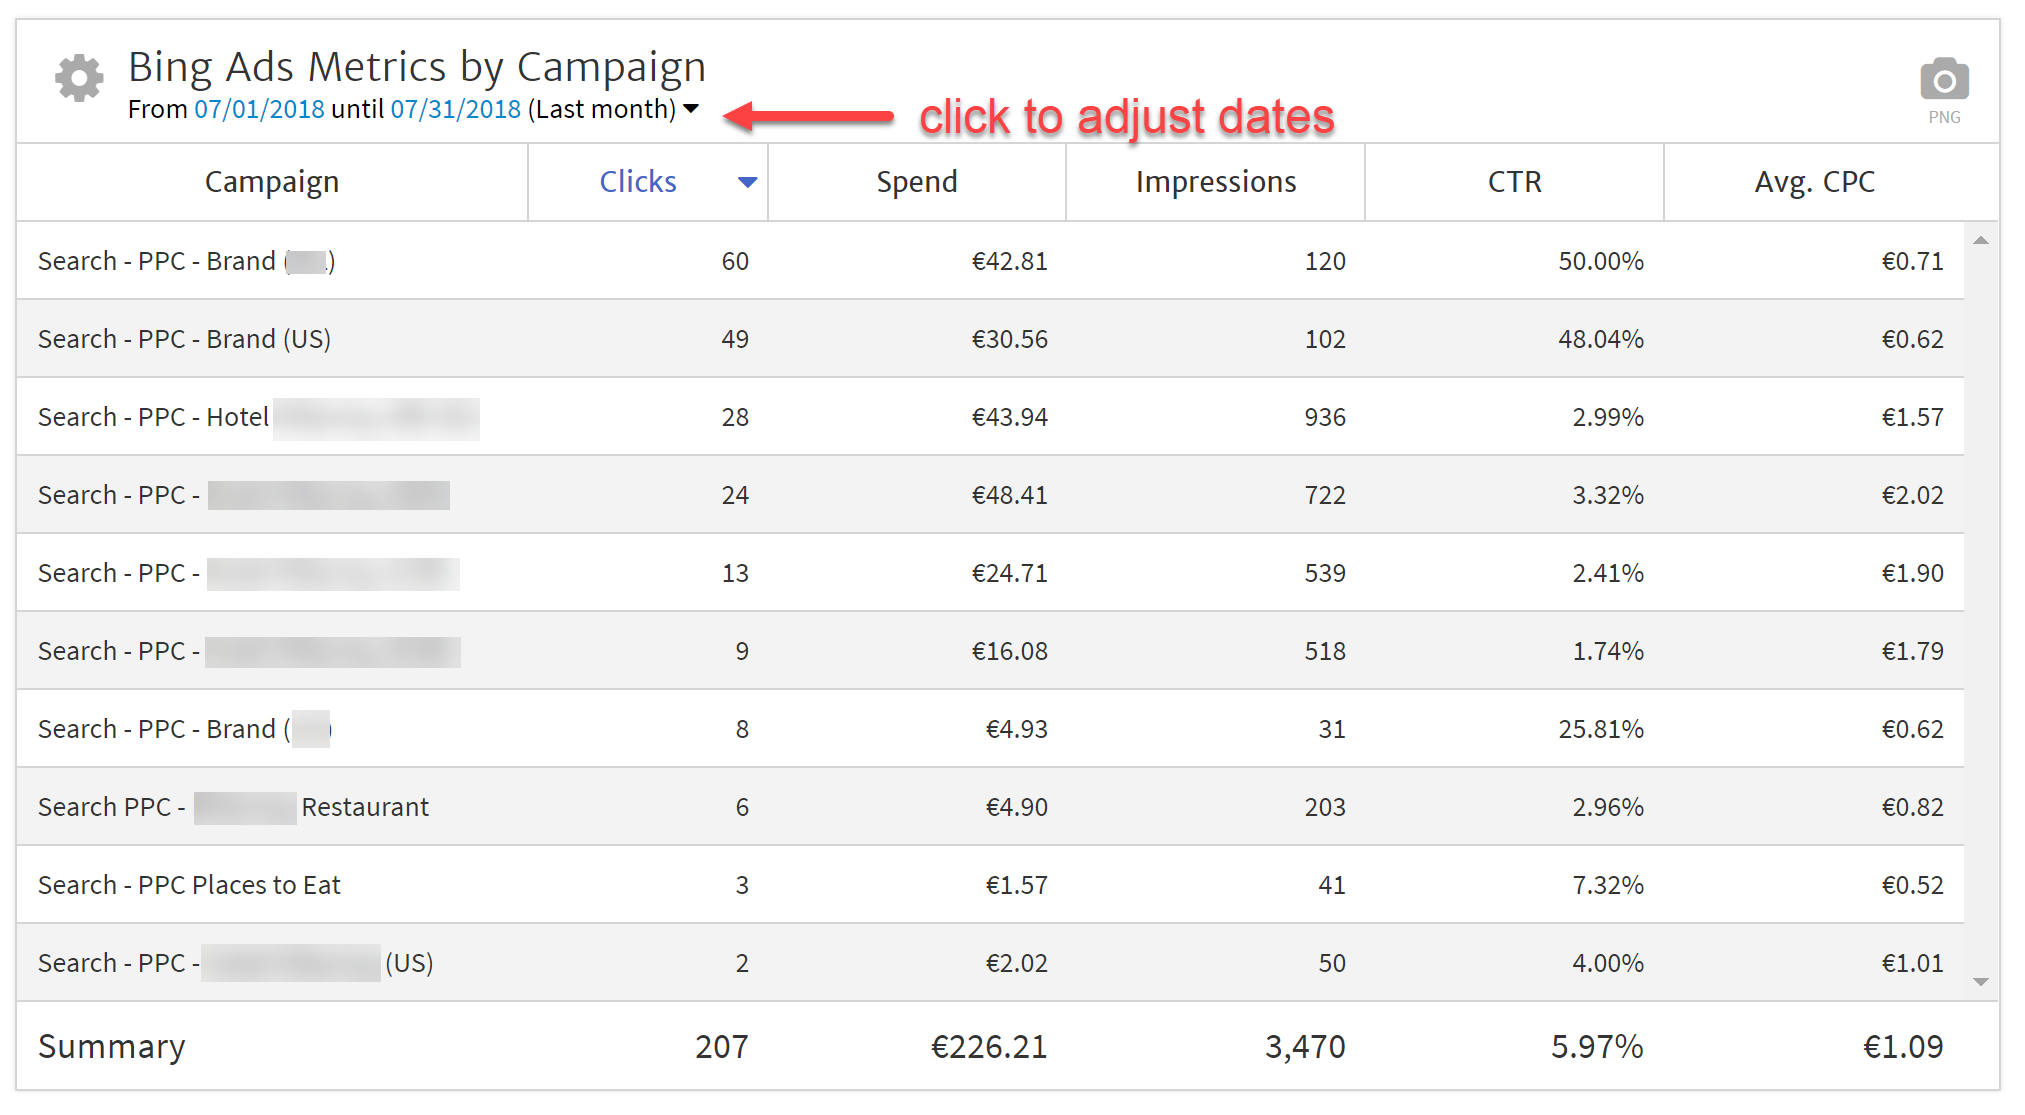
To see the contents of this sample report, scroll down. In Megalytic, data is presented using Widgets. The first widget you’ll see is titled “Bing Ads Metrics by Campaign” and it shows a table of the campaigns that were active during the last month where the columns are five Bing Ads metrics: Clicks, Spend, Impressions, CTR, and Avg. CPC.
You can adjust the column widths and sort by any of the metrics by clicking on the top of the column. By default, this widget is showing the last month's data. But, you can click on the date range to adjust it.
When you click on the date range, it opens the Megalytic date picker. Here, you can select a Period (Daily, Weekly, Monthly, Quarterly) and a Date Range (Last month, Last 3 months, Last 6 months, etc.). When you choose a date like that, using Period and Date Range, Megalytic will automatically update the data as time goes by. So "Last month" will show July data during August, but as soon as it is September, the table will be updated to show August data. These are called Rolling Date Ranges . You can also manually select a start and end date to pick a Custom Date Range . A Custom Date Range is static; it does not automatically update as time goes by.
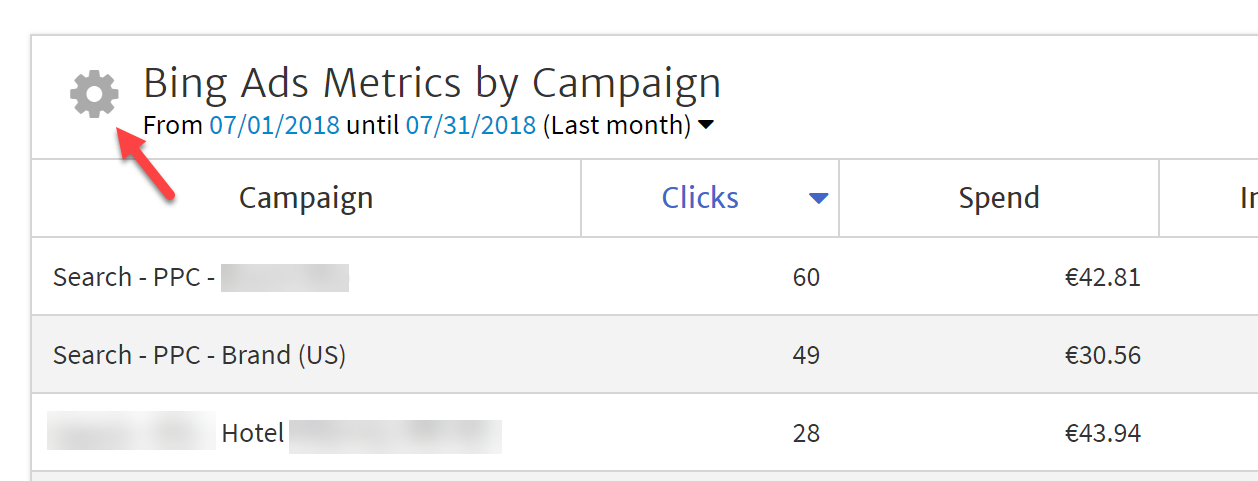
To edit the table itself, click on the gear symbol in the upper left corner. This opens the Widget Editor where you can adjust the Chart type (e.g., Line, Bar, Table), change the dimensions (e.g., Campaign, Ad Group, Ad, Keyword), adjust the number of rows, apply filters to the data, and make a whole variety of changes to customize the data presentation to meet your needs.
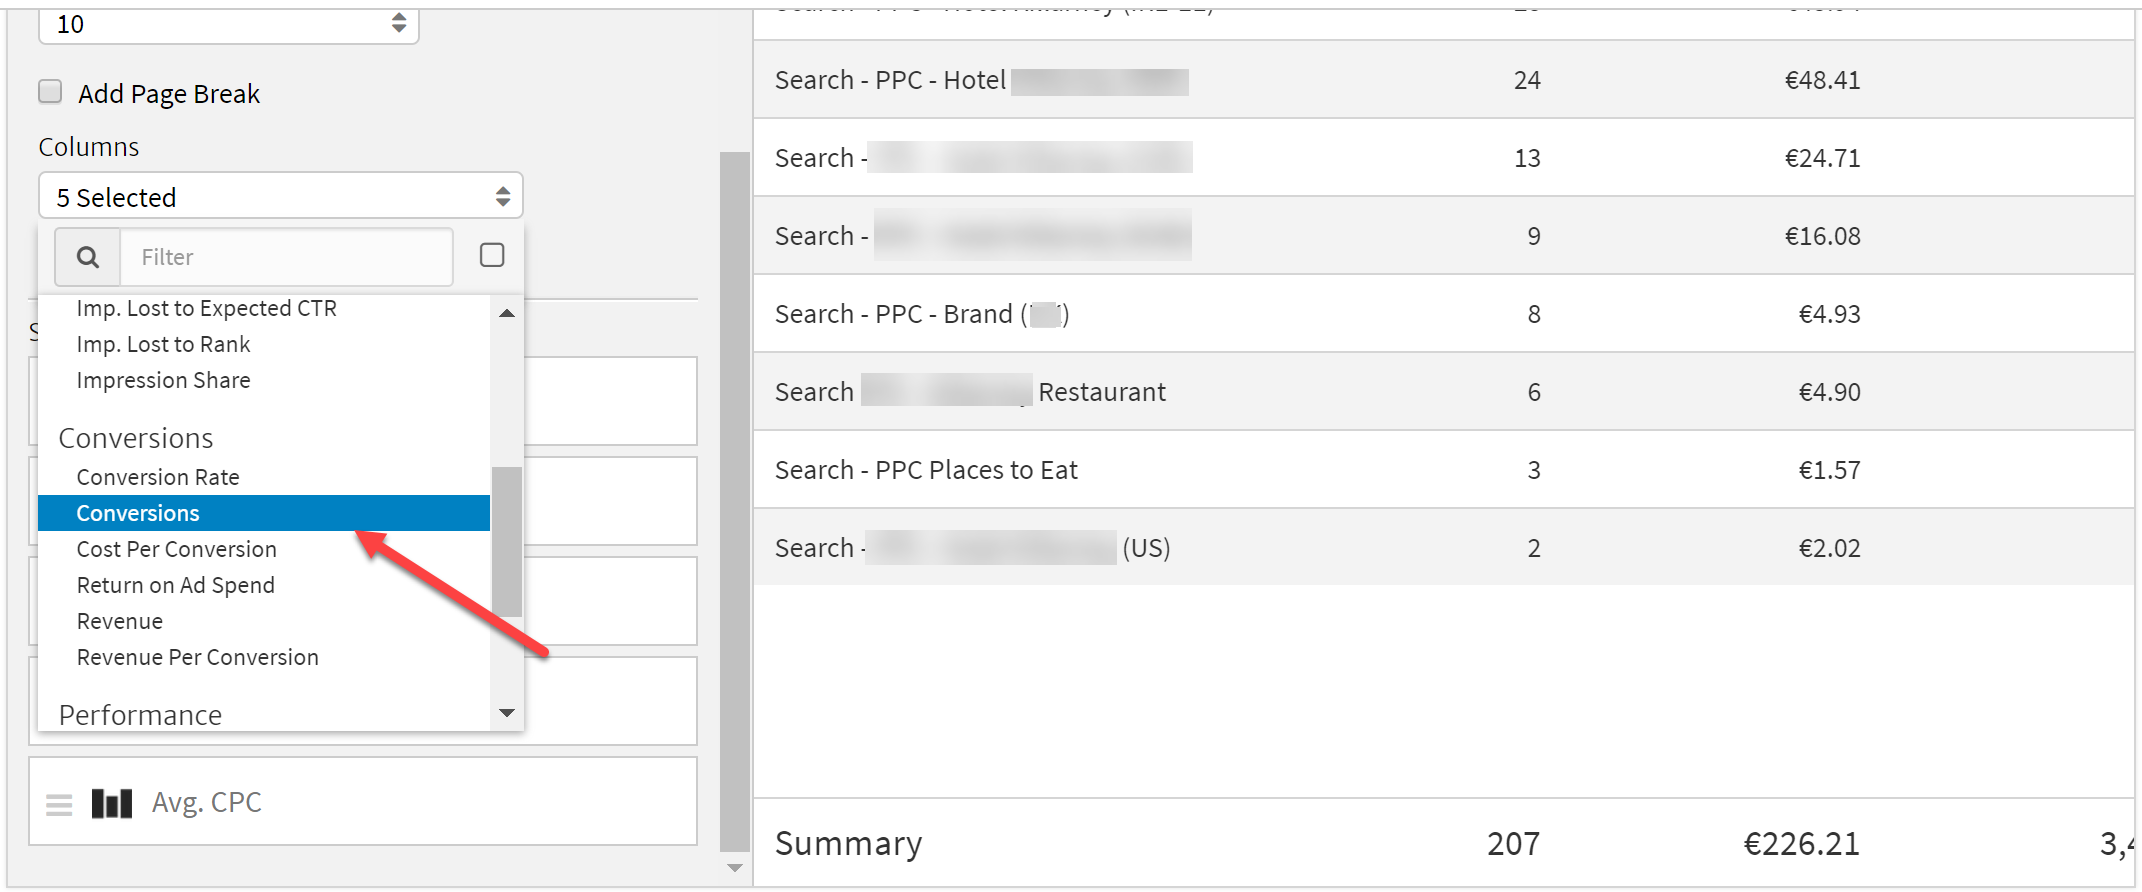
For example, if you want to include the Conversions metric in this table, you would open the Widget Editor, scroll down to the Columns picker, and select "Conversions". The new column will appear at far right side of the table, but you can adjust the order of the columns by dragging them up and down in the Widget Editor.
Comparing Date Ranges - Month over Month, Year over Year
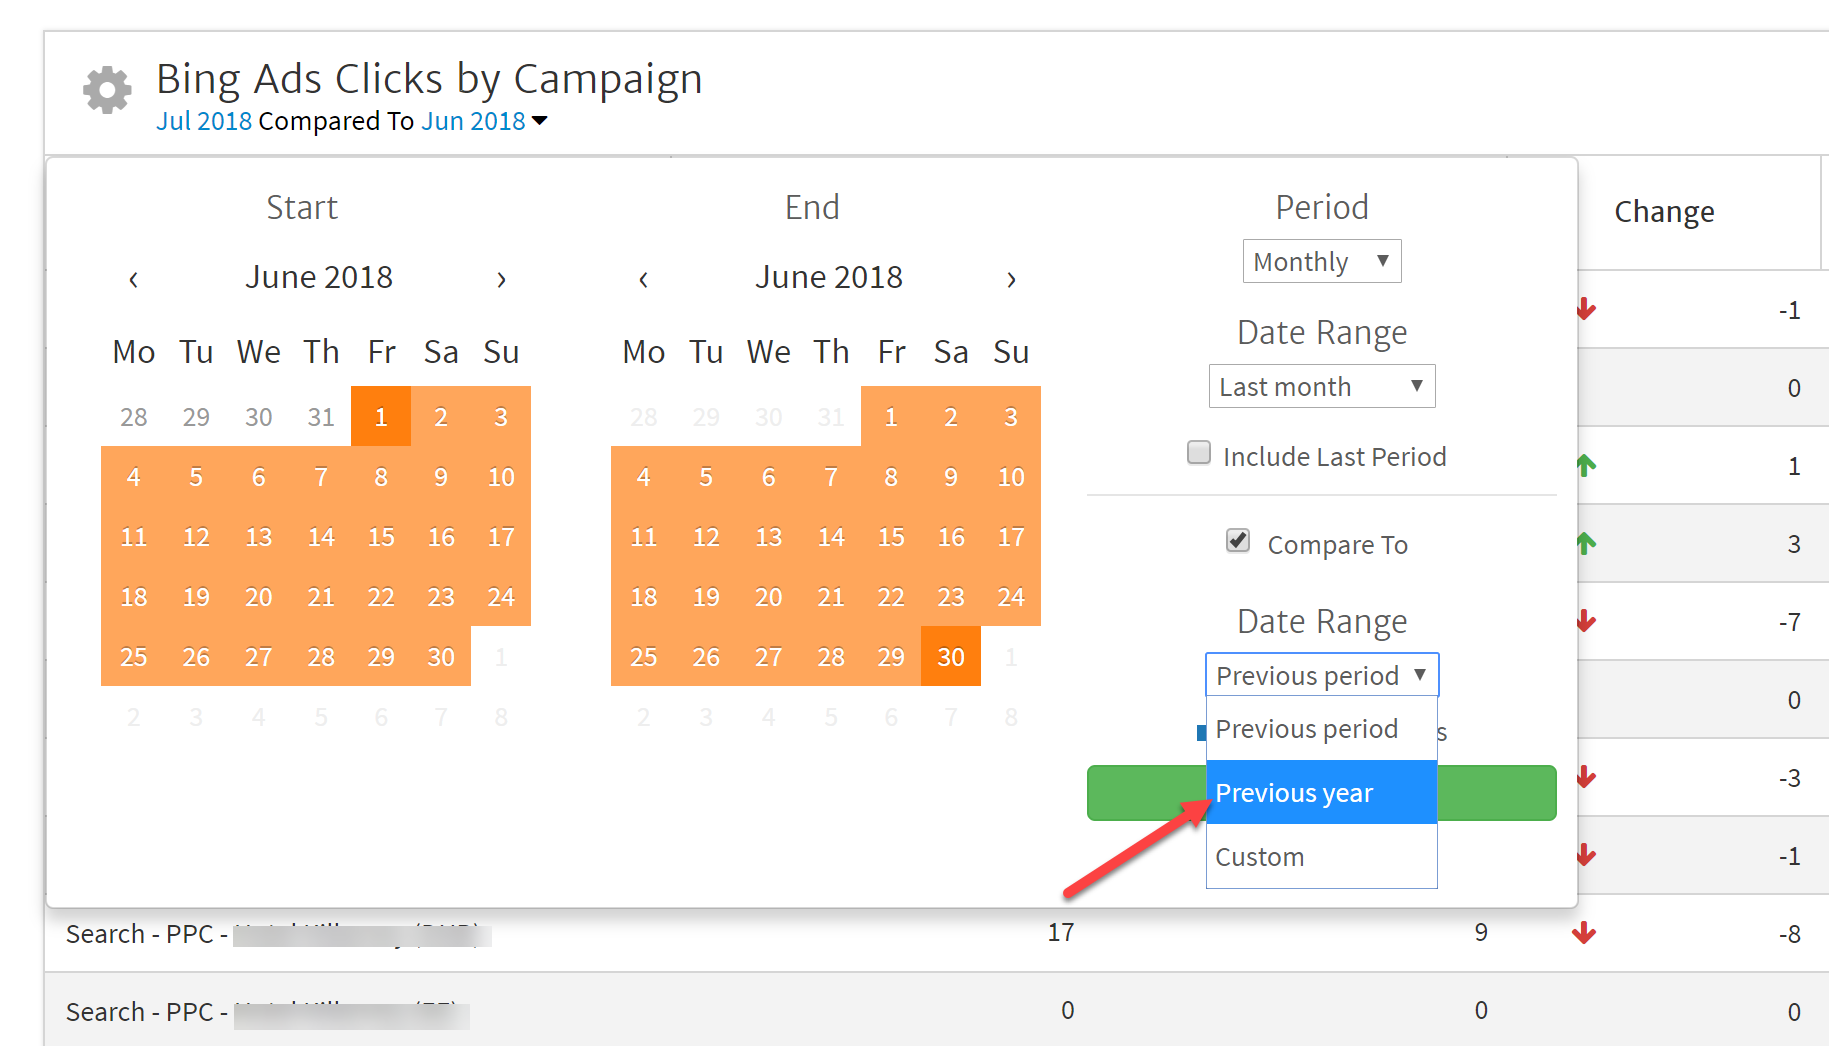
If you continue scrolling down in the sample report, you will see that the next widget compares the Campaign Clicks for this month vs. last month. You can use Megalytic to compare Bing Campaign, Ad Group, Ad, and Keyword performance between date ranges. By default, in this report, you see Clicks compared Month over Month across Campaigns.
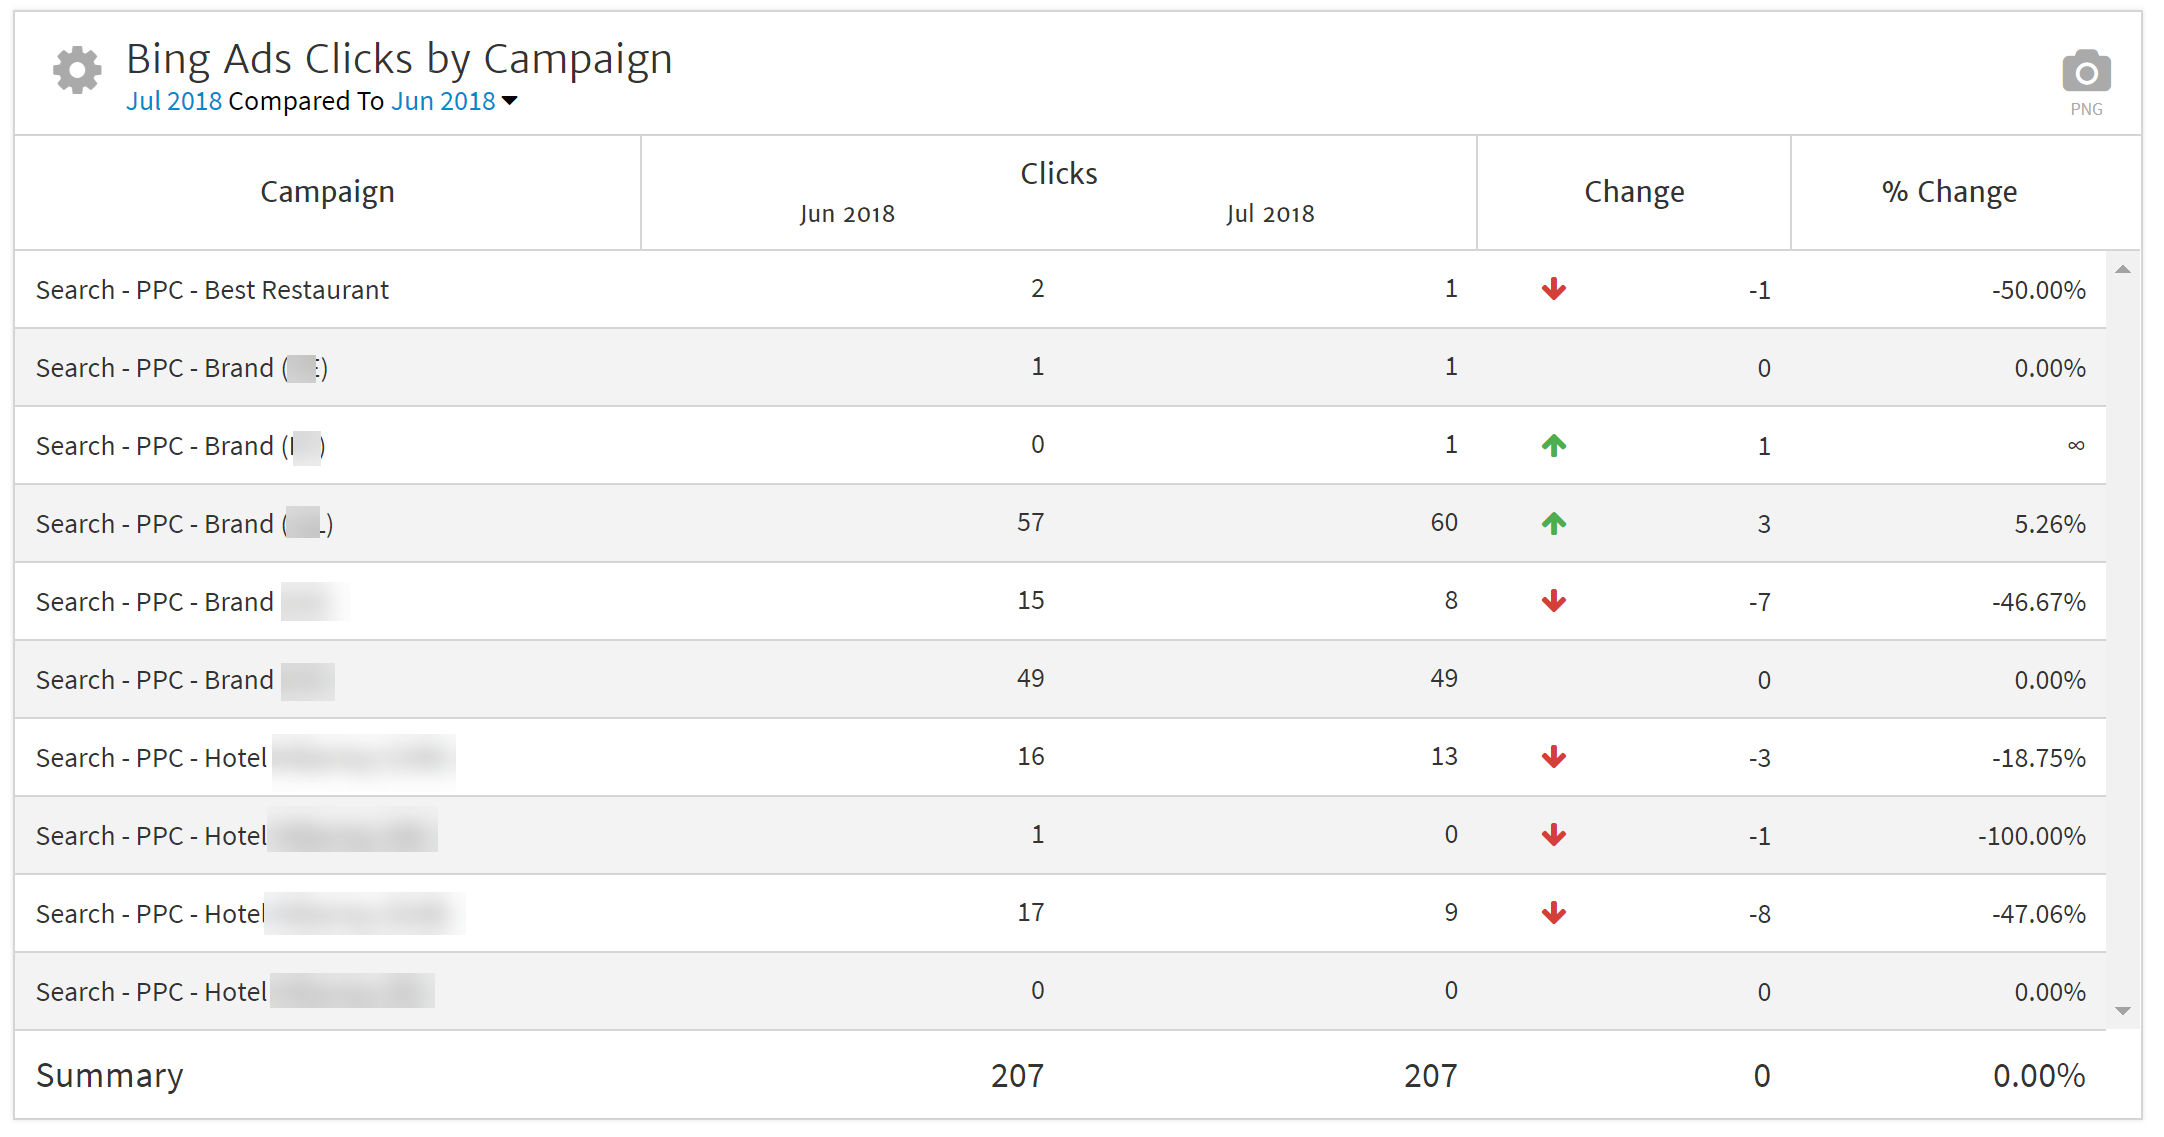
You can easily switch this to be a Year over Year comparison, by clicking on the date range to open the Date Picker, and then selecting "Previous Year" under the "Compare To Date Range".
Campaign Spending Over Time
Continuing to scroll down in the report, the next widget is a time series bar chart showing the spending by the top four campaigns over time. A chart like this lets you see how the composition of your Bing Ad spending has changed over time.
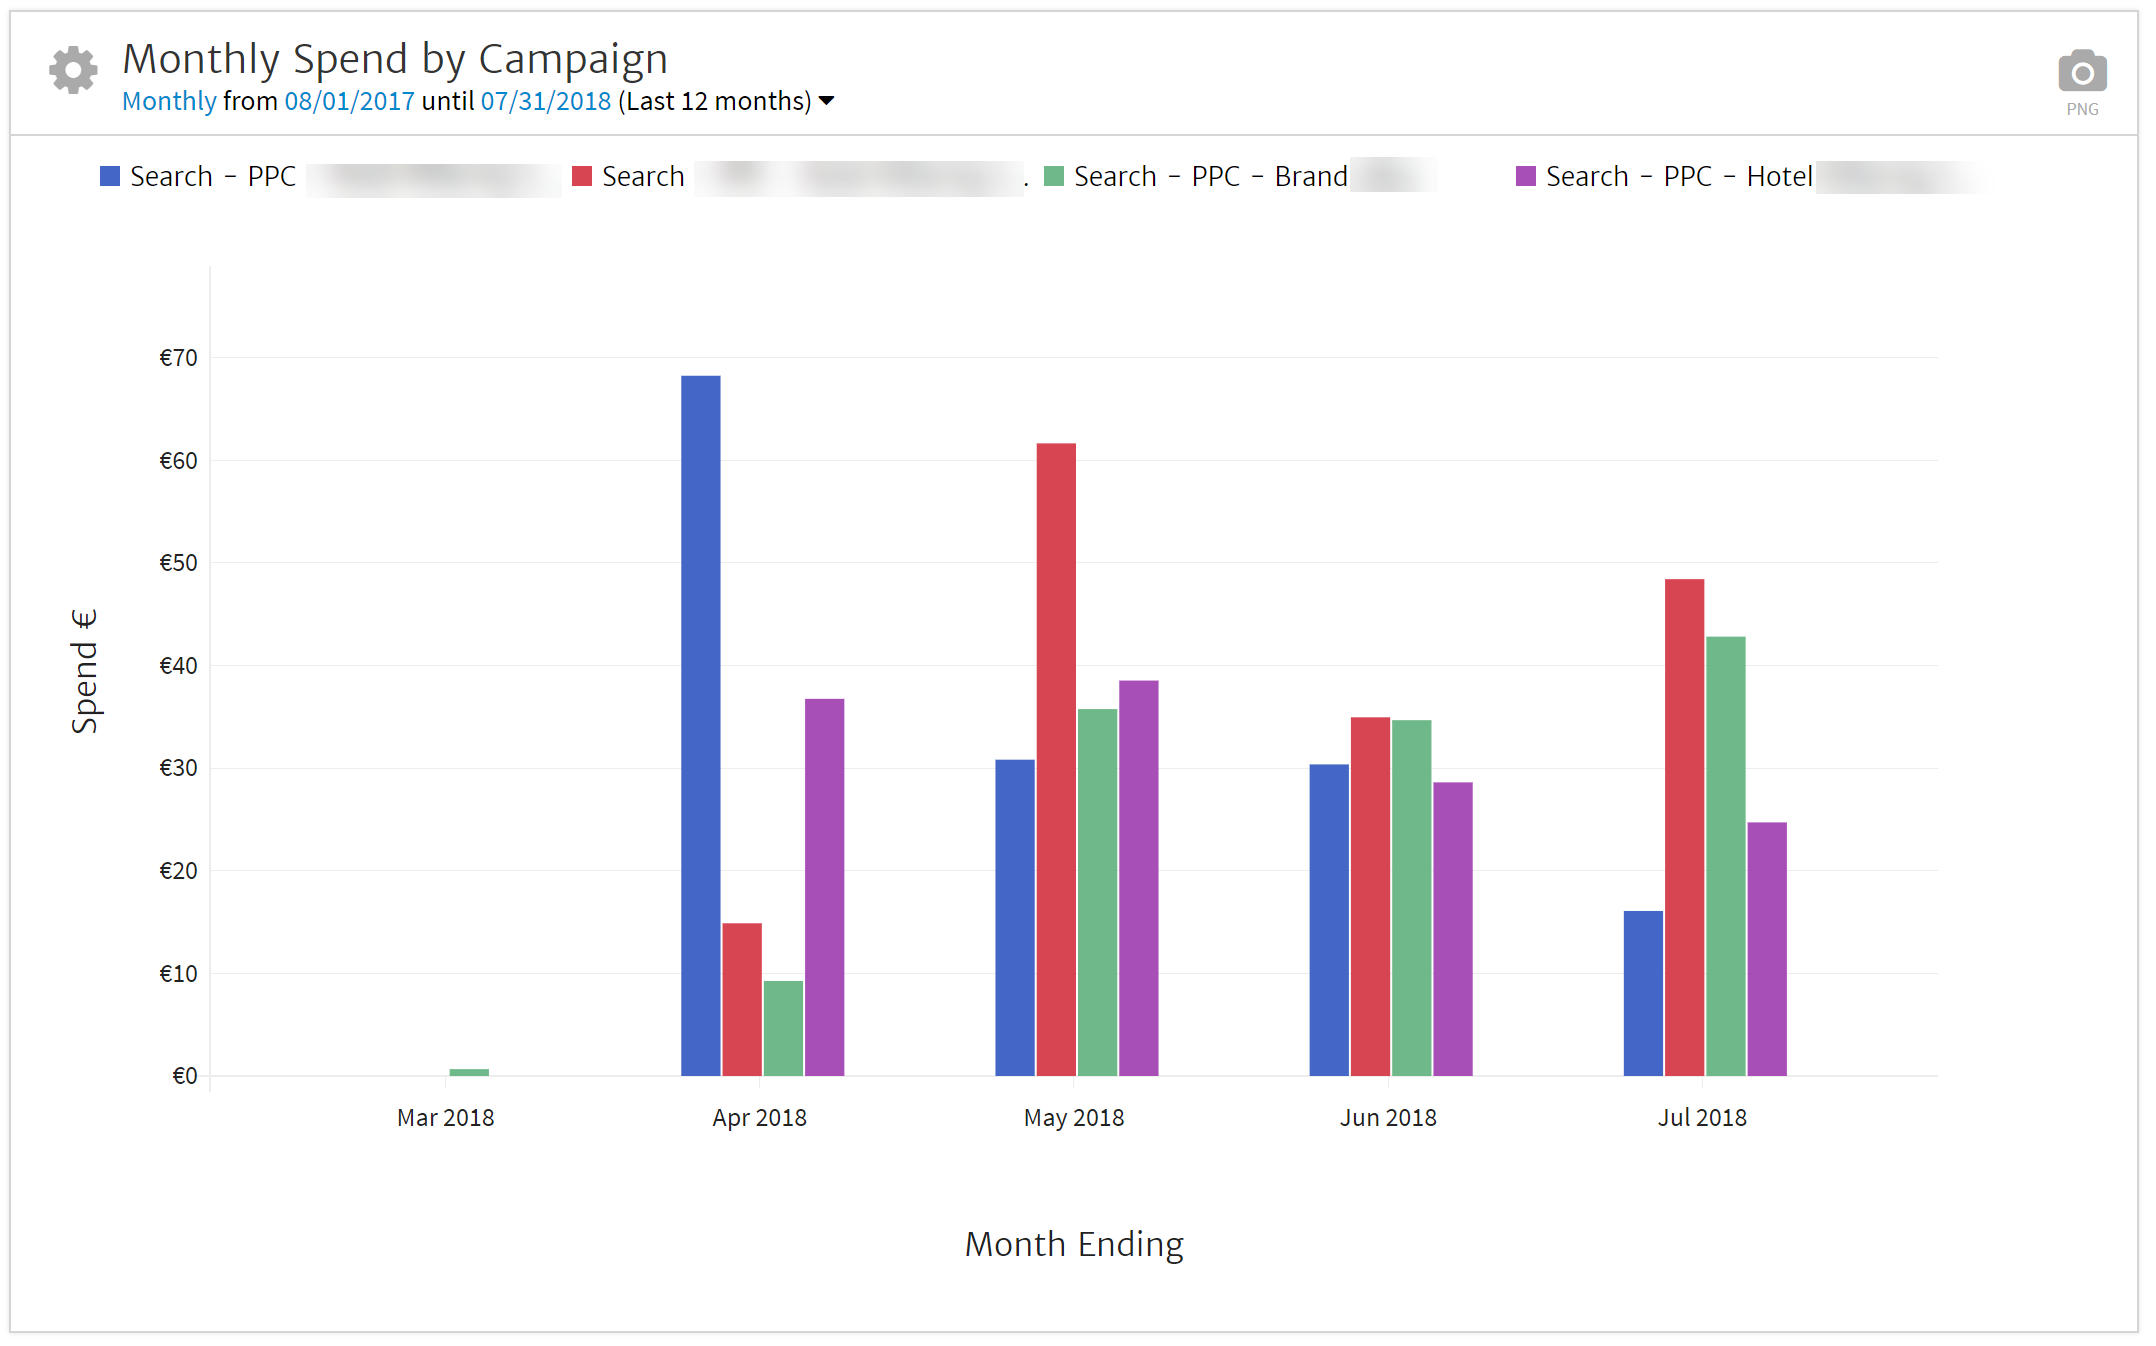
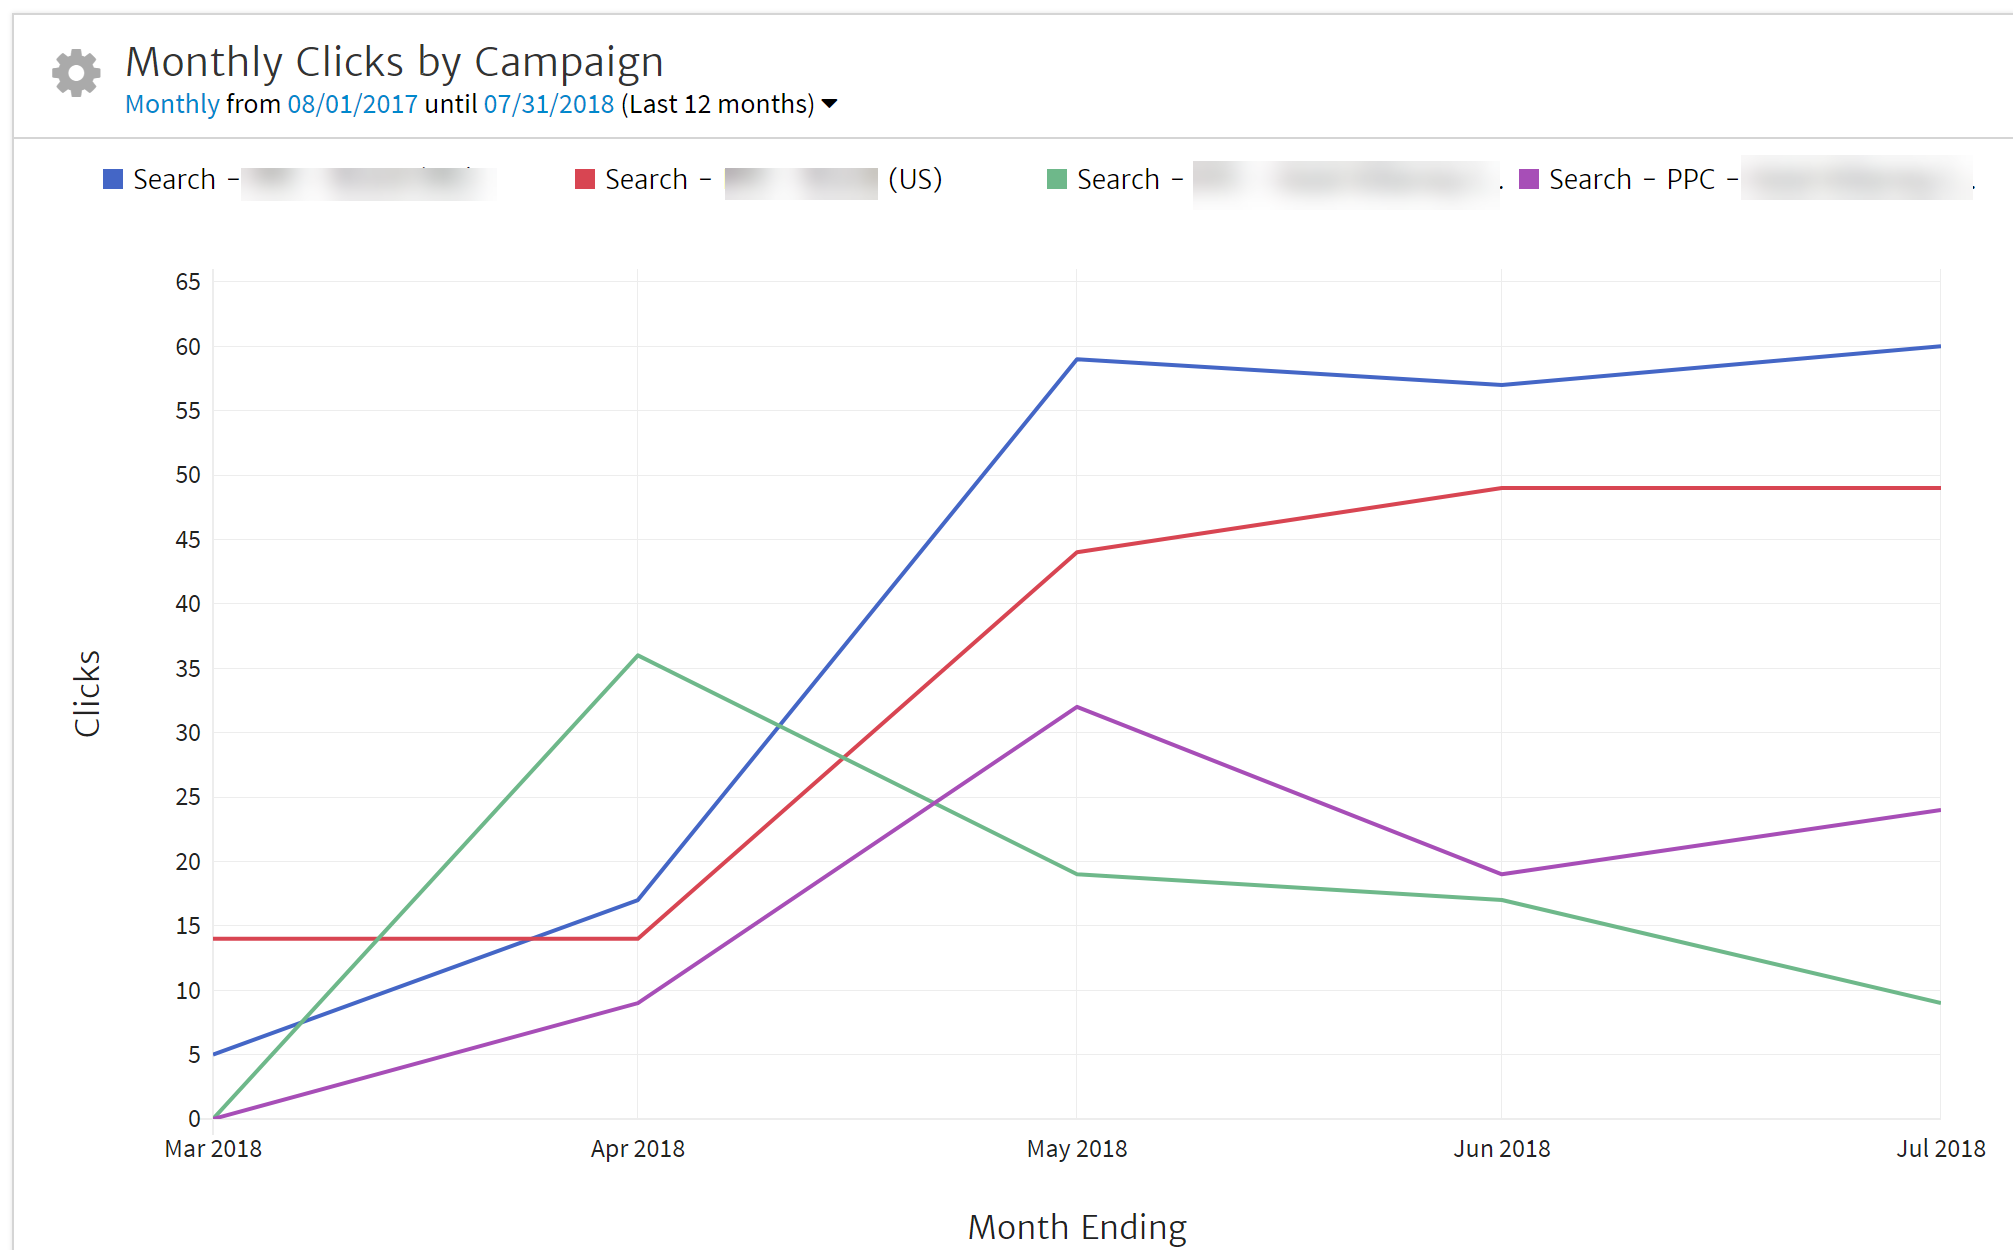
In addition to the Spend, you can see the changes over time for Clicks, or any other Bing Ads metric that you are interested. You can also change the presentation to show a line chart rather than a bar chart.
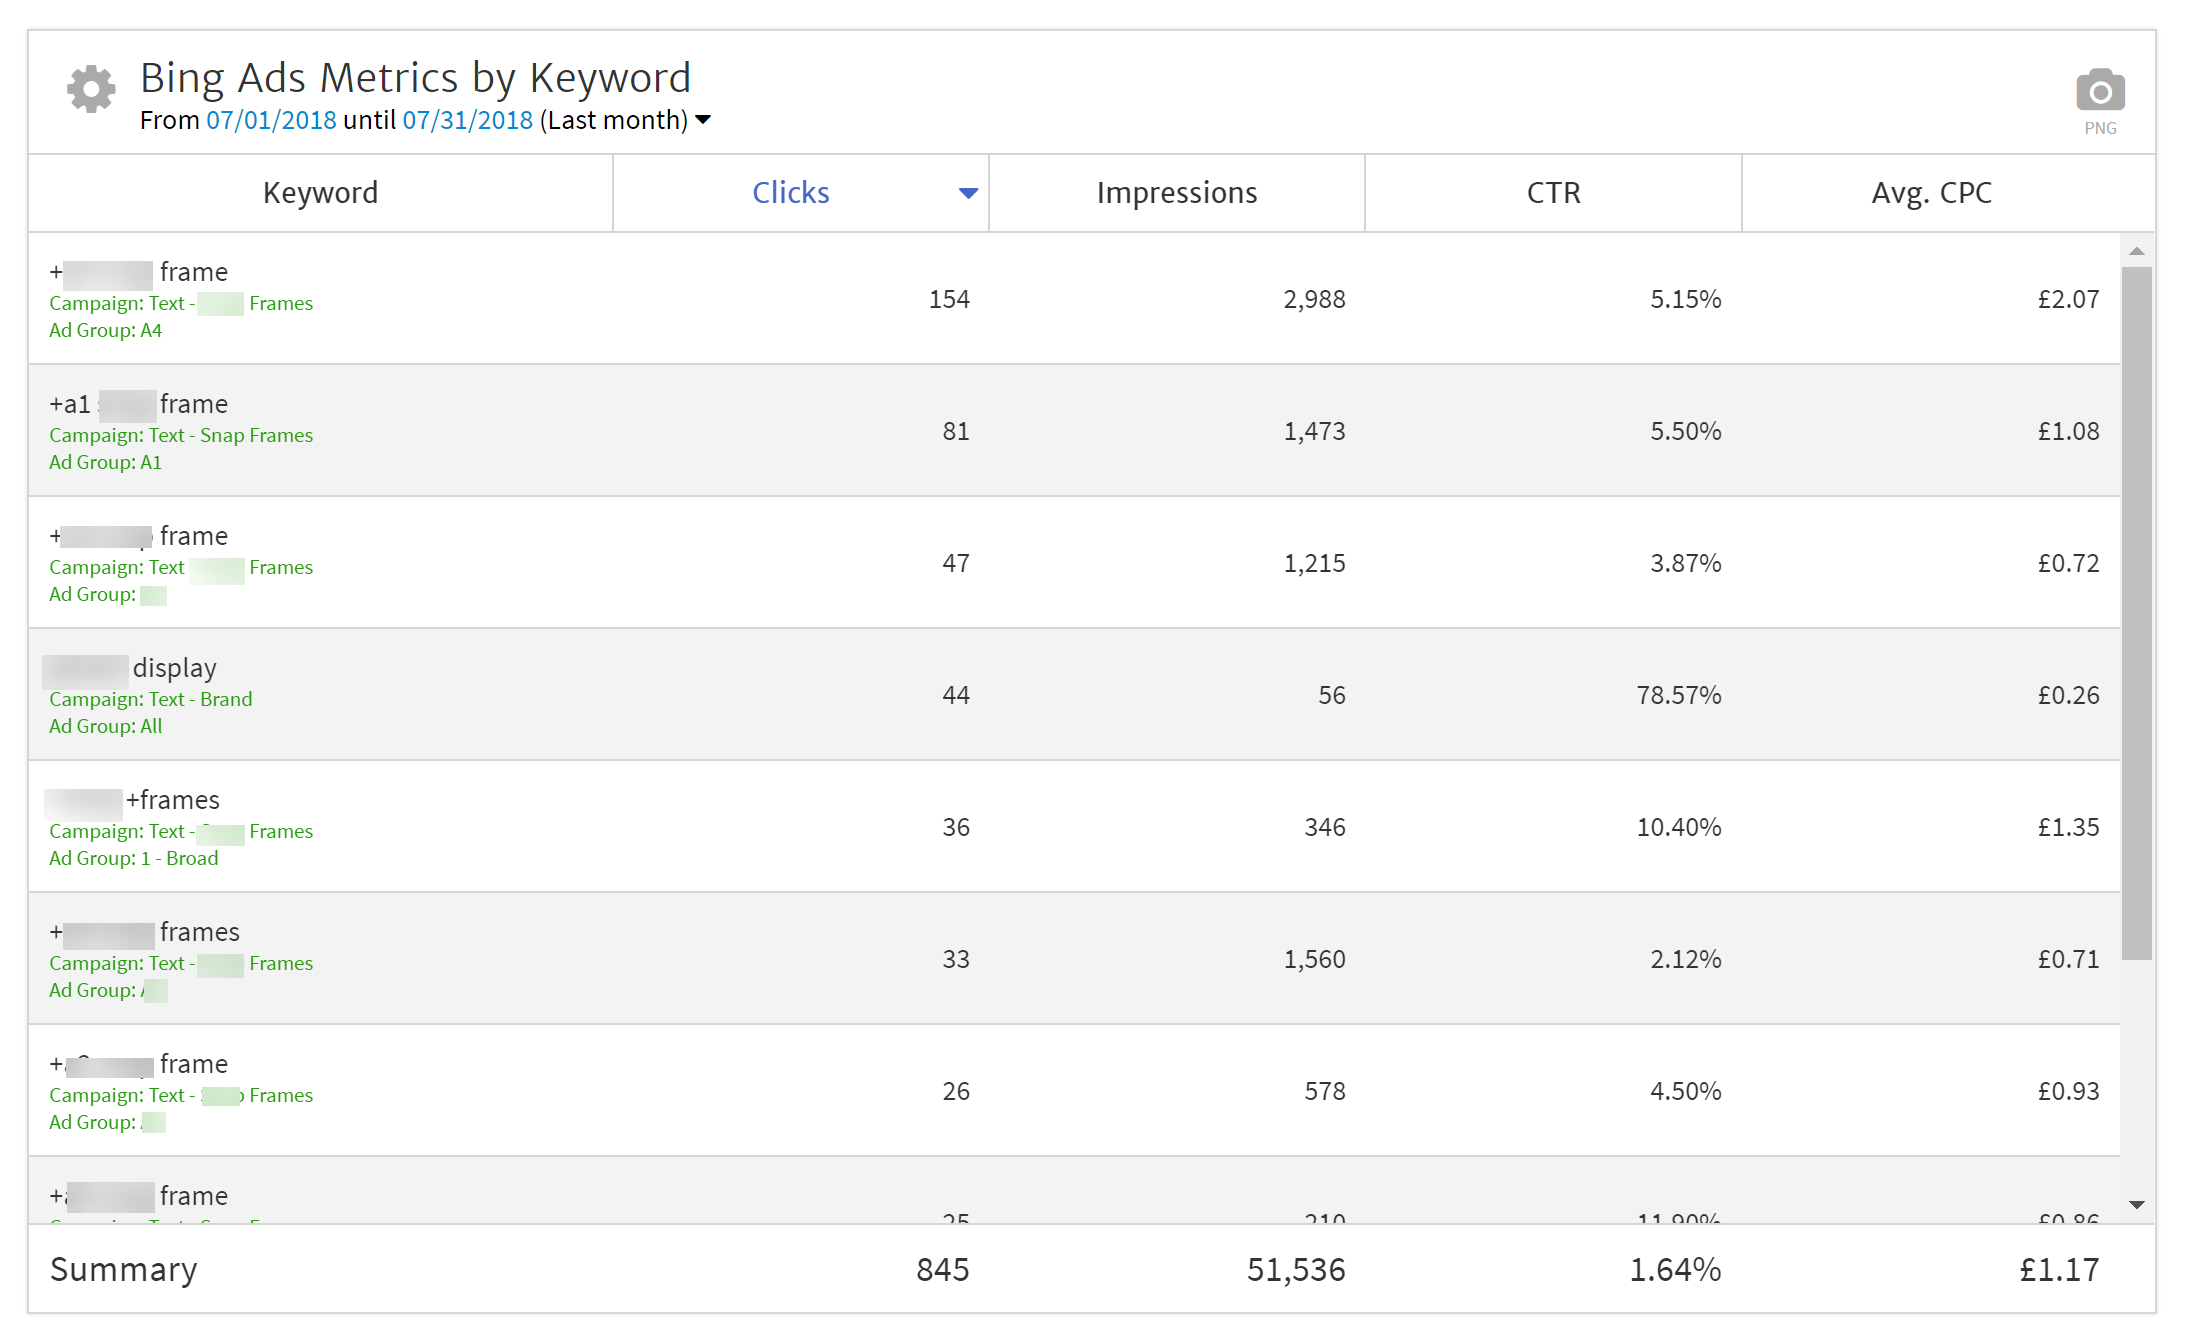
Keyword Level Reporting
In addition to showing data at the Campaign level, you can drill down to Ad Sets, Ads, or Keywords. To do this, you open the Widget Editor and select the Dimension, setting it to Keyword.
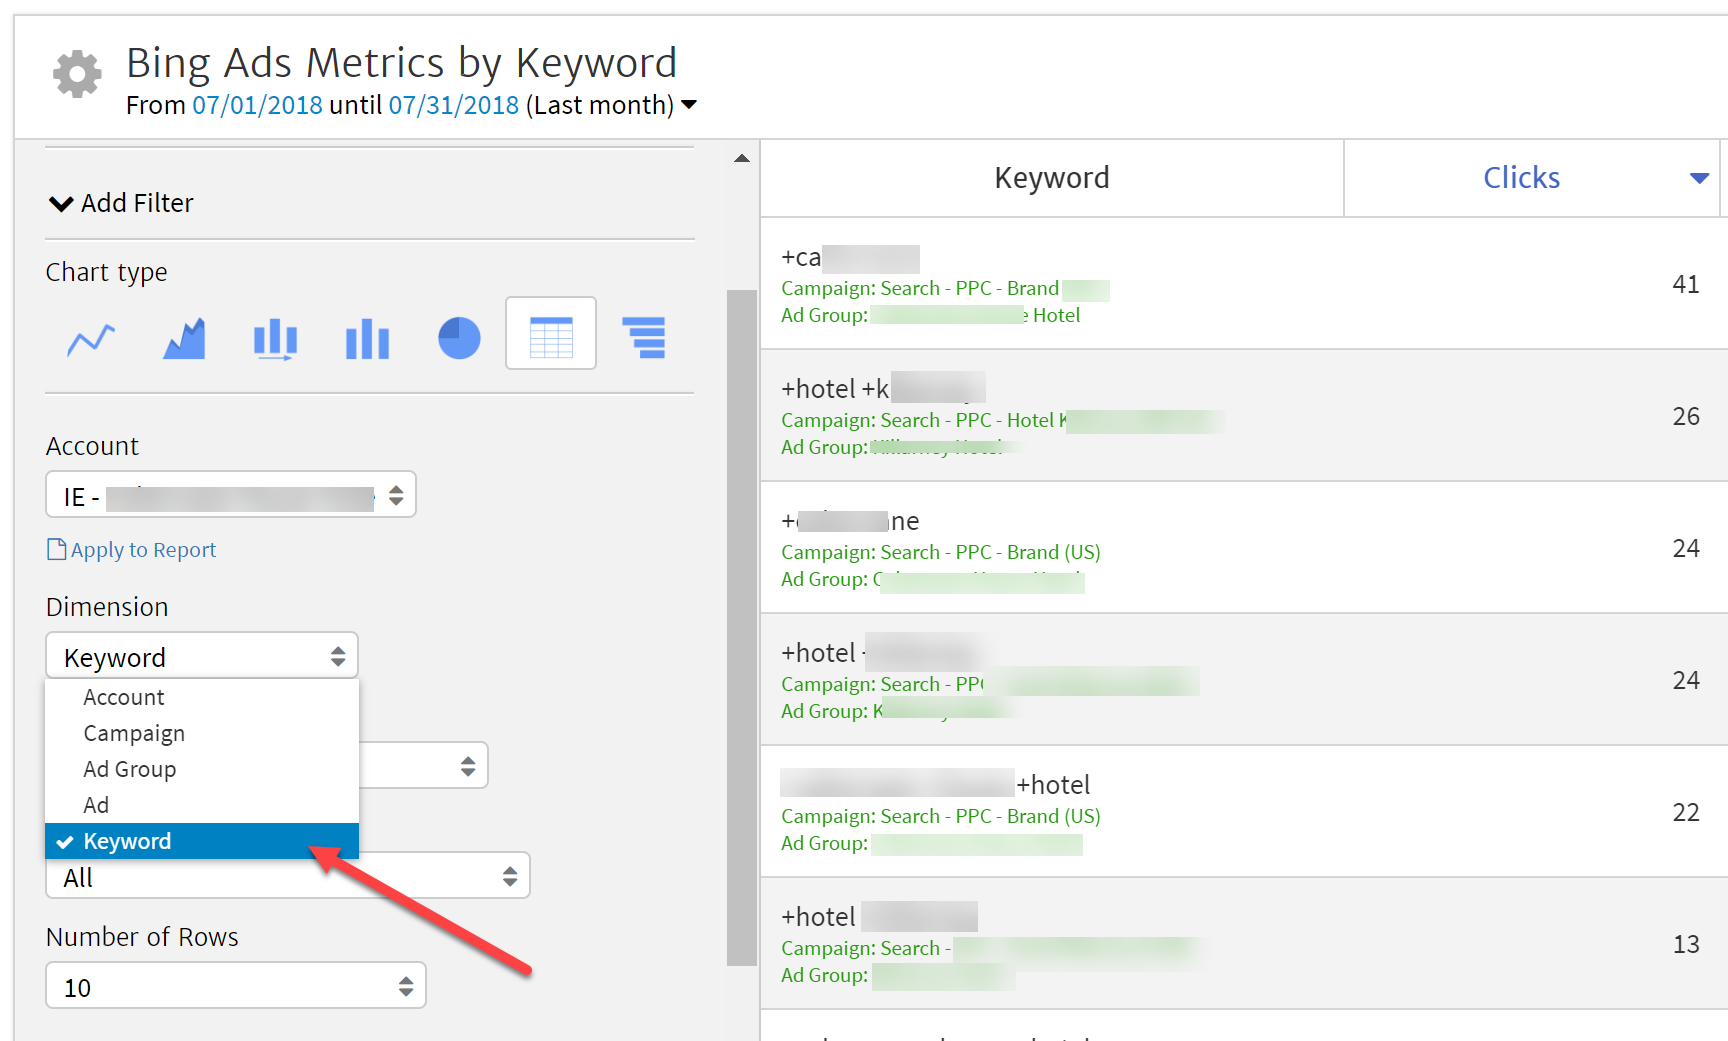
The resulting table shows the Bing Ads metrics broken out by Keyword. Along with the Keyword, you can also see the Campaign and Ad Group that the Keyword belongs to. Here, we are showing Clicks, Impressions, CTR, and Avg. CPC, but you can adjust these column to show other metrics, such as Spend.
Conclusion
We are excited to be able to offer Bing Ads reporting. Together with Megalytic's existing Google Ads capabilities, we now offer a full featured reporting suite for SEM campaigns.