
May 20, 2024
Once you’ve created and launched a LinkedIn Ads campaign, you’ll need to analyze its performance and look for opportunities to optimize and improve it. In this post, I’ll give you an overview of the LinkedIn Ads dashboards and reporting interface to help you get comfortable analyzing your ad campaigns on LinkedIn.
The LinkedIn Ads platform has a fairly simple interface and to get started, we’re going to review the “Ads” section of the ads manager. This will bring you to a table presenting each of your campaigns.
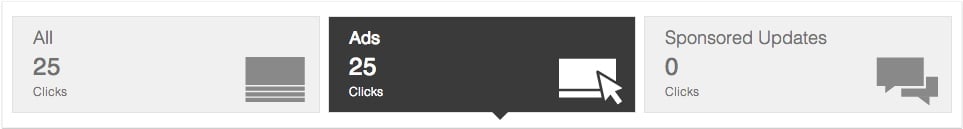
All Campaigns
The campaign view provides a high-level look at your overall account performance over a pre-selected date range (which you can change).
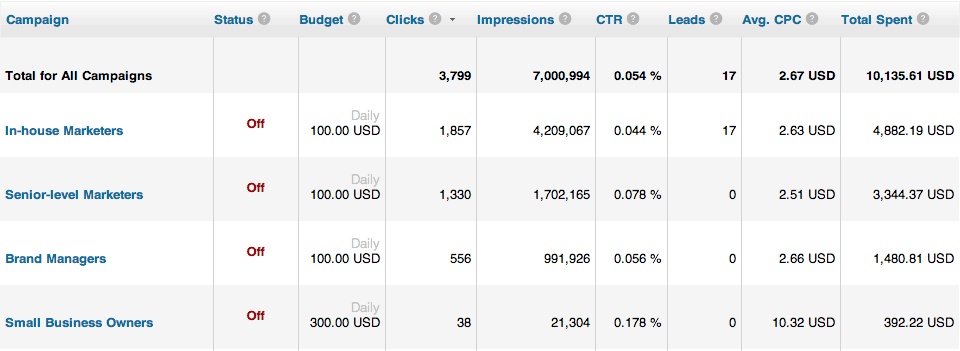
The table below the graph displays your performance split up by campaign. Here are the metrics presented:
- Status – Whether your campaign is on, off or hidden.
- Budget – The maximum you’re willing to spend on each campaign.
- Clicks – The number of times ads in this campaign were clicked.
- Impressions – The number of times ads in this campaign were shown.
- CTR – Clickthrough rate is how often people who saw ads in this campaign ended up clicking it. CTR is clicks divided by impressions.
- Leads – The number of people who requested that you contact them through LinkedIn’s Lead Collection Tool (if utilized).
- Avg. CPC – Average cost-per-click is the average amount that you've been charged for a click on your campaign’s ads. Average CPC is spend divided by clicks.
- Total Spent – The amount you’ve been charged for your campaign.
Your campaigns house a set of ads and are where you set your budget and targeting settings . Your optimization goal when looking at your campaigns together is to allocate money towards your best performing campaigns, according to your objectives.
Individual Campaigns
Clicking into one of your campaigns will present you with that campaigns details, the highlight of which being the Ad Variations table showing the performance of each ad in your campaign.
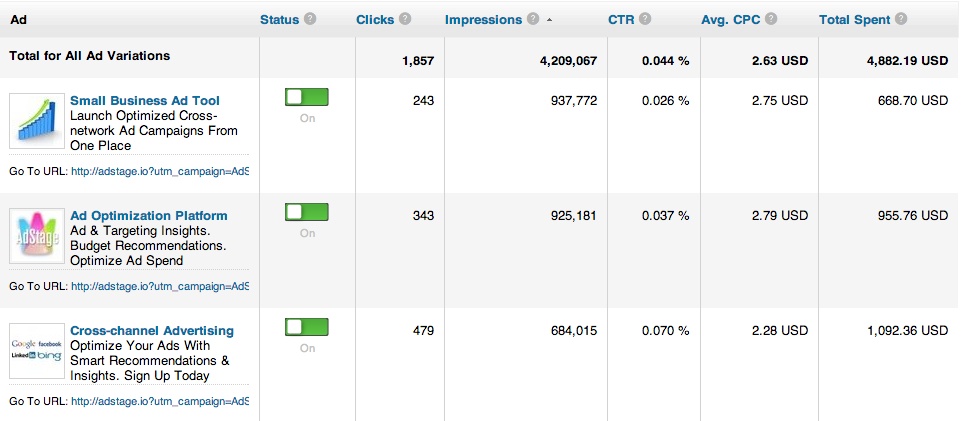
Here are the metrics you’ll see in the ads table:
- Status – Whether your ad is on, off or hidden.
- Clicks – The number of times this ad was clicked.
- Impressions – The number of times this ad was shown.
- CTR – Clickthrough rate is how often people who saw your ad ended up clicking it. CTR is clicks divided by impressions.
- Avg. CPC – Average cost-per-click is the average amount that you've been charged for a click on your ads. Average CPC is spend divided by clicks.
- Total Spent – The amount you’ve been charged for your ads.
The ads in this table are essentially competing against each other in order to display to your targeted audience. Whichever ad displays must capture the attention of your audience and compel them to click. Because of this, you want to test ad variations frequently and compare their performance in order to find the winners. Your optimization goal is to pause weak ads and fund those that perform best.
See a Campaign’s Engaged Audience
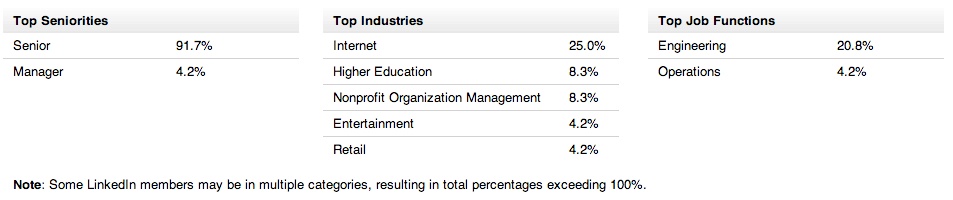
When looking at an individual campaign with performance data, you’ll see the following bar below the graph. Click it to see your campaign’s engaged audience.
![]()
With this data, you can see the type of audience that has clicked on your ads. These insights can prove helpful when analyzing your ad performance.
Optimization Examples
When analyzing your ads, you’ll want to compare each ad’s metrics to others in the campaign in order to guide your optimization. Here’s a couple examples of what you could find:
- Low CTR – This means people aren’t clicking on your ads when they appear. This could be because your ad isn’t capturing their attention on the page, or it may not be interesting enough to the people you’re targeting. You could pause the ads with the lowest CTR in order to serve you higher performing ads more frequently. You should also try creating new ads that are more eye-catching and compelling.
- Low Impressions – This means your ads aren’t be shown very often. It could also be because your target audience is too small, but more commonly it’s because your bids are too low. Try raising your bids in order to top competing advertisers, or try relaxing your targeting in order to increase the number of people your ad is eligible to display to.
For more optimization help, check out 5 Must-Try Tips for Optimizing LinkedIn Ads .
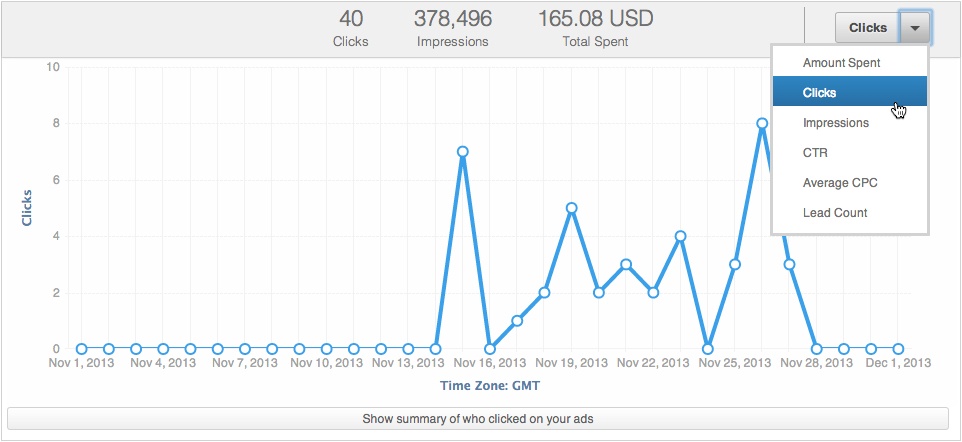
Graphs
The campaign and ad tables show you your aggregate performance data for a given time period, but they fail to show you how your performance metrics change over time. Because of this, it’s helpful to review the line graphs to see how and when a metric has changed. Look for peaks, valleys and trends to measure the impact of the changes you’ve made.
Reports
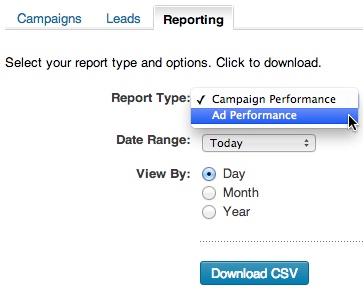
LinkedIn’s reporting interface allows you to create a CSV spreadsheet of you performance. Follow these steps to generate your report:
- Visit the Reports tab.
-
Select your desired report type:
- Campaign Performance – This report provides a spreadsheet of your performance split by campaign.
- Ad Performance – This report provides a spreadsheet of your performance split by ad.Customize your reports by selecting Dimensions (rows) and Metrics (columns).
- Set your desired date range.
-
Select how you’d like your performance broken down further:
- Day - Splits your performance by day.
- Month - Splits your performance by month.
- Year - Splits your performance by year.
- Click Download CSV.
And for more advanced reporting that presents your LinkedIn data side-by-side with Google, Bing & Facebook campaigns, check out the AdStage all-in-one ad management platform: