
May 20, 2024
There’s probably no tool more dear to a digital marketer's heart than Microsoft Excel. It’s the must-have data analysis program that helps turn raw numbers into actionable insights.
Here are five of my favorite Excel features that I’ve learned to love over the years.
5. Table Formatting
Difficulty: Beginner
Table Formatting lets you apply a beautiful table style to your raw PPC data quickly.

For example, you can use it to convert your plain AdWords campaign performance report to a presentation-ready table.
How to set it up:
- Remove any extra title and total rows
- In the Table ribbon, select a predefined table style
- Your table will now feature clear formatting and filterable headers
Learn more about table formatting for PPC.
4. Macros
Difficulty: Intermediate
Macros let you automate repetitive tasks in Excel by recording your manual actions so you can replay them in future worksheets later with a single keystroke.

For example, you can create a macro that removes title and total rows from your AdWords spreadsheets for easy analysis with pivot tables.
How to set it up:
- Download and open an AdWords campaign performance report in Excel
-
From the Developer ribbon, click
Record
- Assign a keyboard shortcut (e.g., Opt+Cmd+S)
- Store the macro in your Personal Macro Workbook
-
Begin performing the manual tasks you’d like to repeat automatically in the future
- Delete the first row in your table (the AdWords report title)
- Delete the last 4 rows in your table (the AdWords total rows)
- Click Stop to conclude recording
- You can now strip the title and total rows quickly by running this macro
Learn more about Macros for PPC.
3. Text to Columns
Difficulty: Intermediate
Text to Columns lets you parse through the data from one column and distribute it into multiple columns.

For example, you could use Text to Columns to remove UTM tracking parameters from your destination URLs. This would make it easy for you to analyze landing page performance in a Pivot Table.
How to set it up:
- Download and open an AdWords ad performance report in Excel
-
Select your Destination URL column, and launch Text to Columns (Data > Text to Columns)
- Leave your data set to Delimited, and click Next
- In the Delimiters section, type “?” into the Other field, and click Next
- In the Data preview section, select the new column (with your tracking parameters)
- In the Column data format section, select “Do not import column (Skip)” and click Finish
- Your Destination URLs no longer contain any of your tracking parameters after the "?" and are ready to be analyzed with a Pivot Table.
Learn more about Text to Columns for PPC.
2. Pivot Tables
Difficulty: Intermediate
Pivot Tables make it easy to summarize, analyze, explore, and present large sets of data. It's a great way to reformat your raw data into interactive tables.
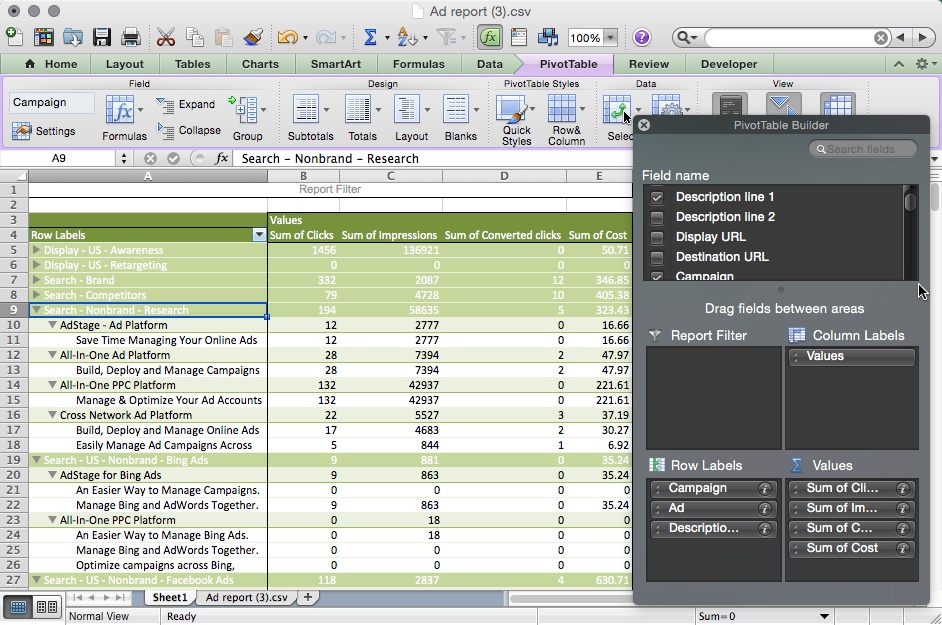
For example, you can use a Pivot Table with the Ad Performance Report from AdWords to quickly discover the best-performing headline of your ads.
How to set it up:
- Download and open your AdWords ad performance report in Excel
- Prepare the table by deleting first row (the report title) and the last 4 rows (the totals)
- Highlight the table, and insert the Pivot Table (Data > Pivot Table)
-
Use the Pivot Table builder to dynamically structure the new table
- Segment performance by campaign and headline by dragging "Campaign" and “Ad” into the “Row labels” field
- View relevant performance metrics by dragging “Clicks,” “Impressions,” and “Converted Clicks” into the “Values” field
Learn more about Pivot Tables for PPC.
1. Formulas
Difficulty: Beginner
Finally, we get to the most beloved Excel feature of all: Formulas. Formulas allow you to perform calculations and take actions on data in your worksheet. There's a myriad of formulas that you can combine to make incredibly powerful spreadsheets.
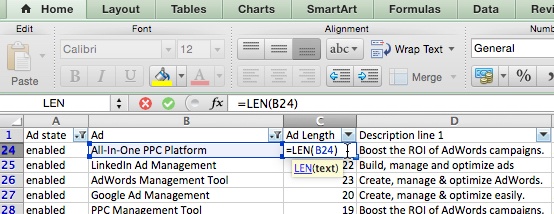
For example, you can use the simple LEN formula to count the number of characters in a cell. This formula is especially useful when writing ad headlines and descriptions.
How to set it up:
- In a cell, type =LEN(
- Then type the reference of the cell you’d like to count (e.g., your ad headline in A2)
- Now, you’ll have a real-time count of the length of your cell
Learn more easy Excel formulas for PPC.
Share Your Favorites
Did I miss your favorite Excel feature? Share yours in the comments below!