
May 20, 2024
Tracking Facebook Users with Google Analytics
By Megalytic Staff - December 17, 2014
![]()
Where Are Facebook Users Going on Your Site?
Your content is encouraging users to click from Facebook to your website. Congratulations!
Where are they landing?
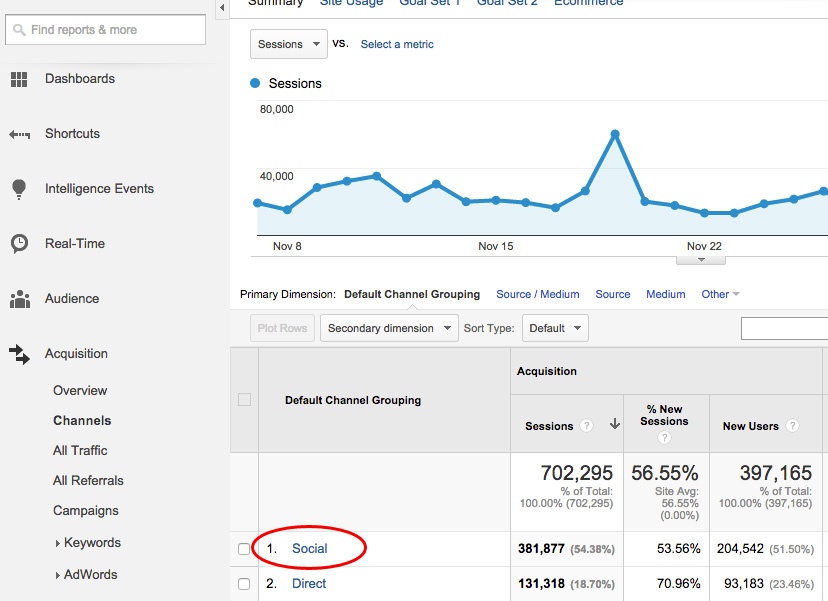
Your first step in tracking Facebook users is to understand where they land on their first contact with your site. Perhaps it was a blog post, a video or a product page you are linking to from your Facebook page. Reviewing this data will help you to understand what types of content are most effective in driving Facebook users to your site and what they’re most interested in. In Google Analytics, there are a number of ways to learn where Facebook users are landing on your site. For our purposes, we will start with the Channels report and drill down to find the data we need. To view your top landing pages from Facebook, start at Acquisition > Channels and select Social from the Default Channel Grouping column.
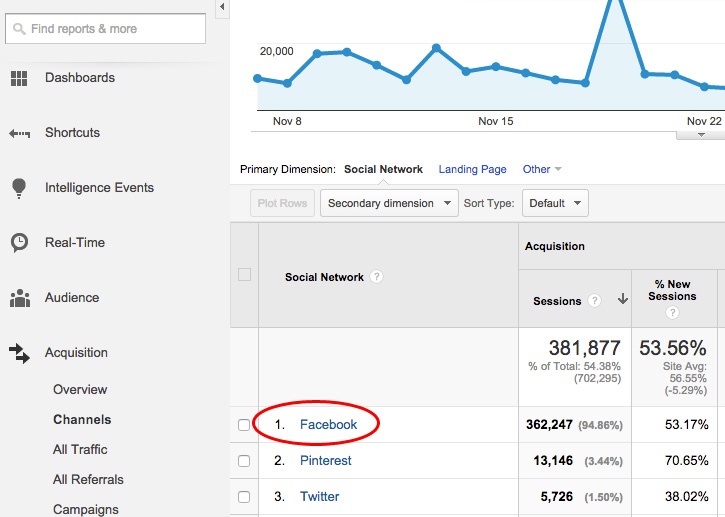
Next, choose Facebook from the list of social networks that appears.
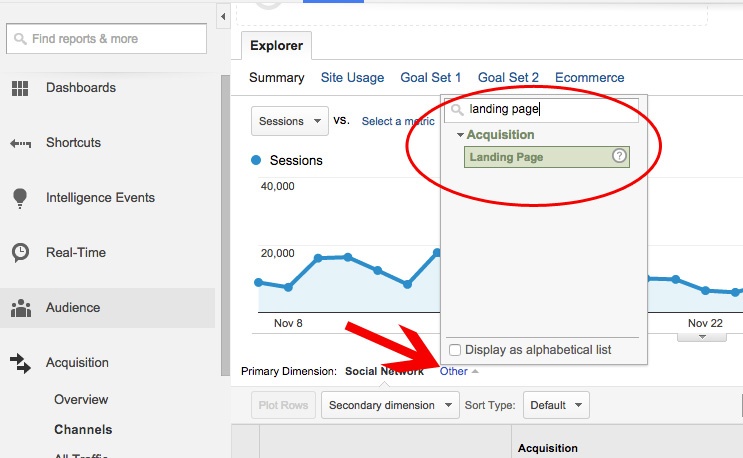
Under the graph, you’ll see the Primary Dimensions table. Select “Other” and type “landing page” into the search bar. Then choose that option.
Once you do, you will see a list of your top Facebook landing pages – the pages visitors land on most when coming from Facebook.
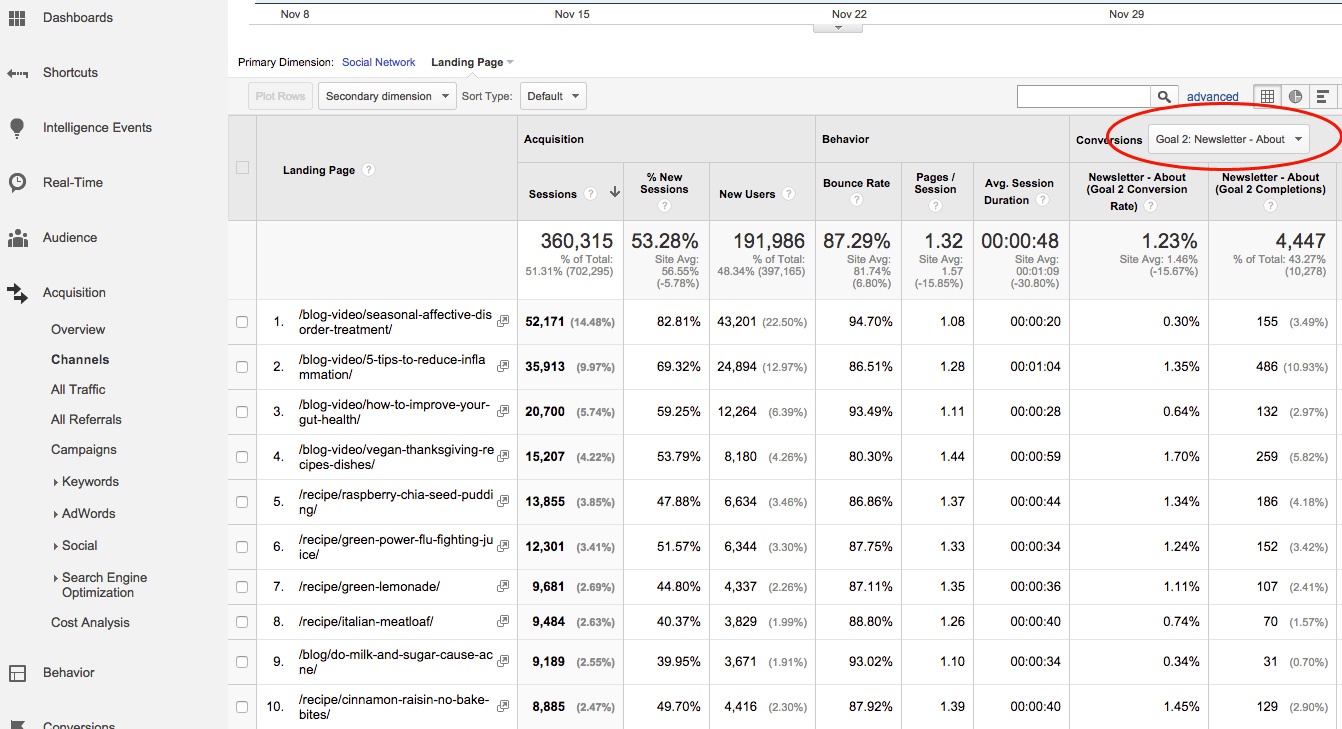
From the screenshot above, we see a post about treating Seasonal Affective Disorder received the most sessions over the past month. This post was published shortly after Daylight Savings Time ended, showing the importance of creating timely content. We also see that health-related topics attract a high number of sessions.
However, we don’t want to look at sessions alone, as we should not attribute success to blog posts purely based on the volume of traffic received. As a whole, even though tens of thousands of Facebook users arrive at blog posts and recipe pages, around 87% of these individuals leave after reading (or skimming) a single page. You can see that in the table above by noting that the overall Bounce Rate (top row) is 87.29%).
So, in addition to the Sessions, we want to look at engagement metrics like Bounce Rate, Pages / Session and Average Session Duration. These tell us about the quality of the traffic coming from Facebook.
As measured by having the lowest Bounce Rate, the best performing post of these top 10 was an article on vegan Thanksgiving recipes, another timely post. This data may indicate value to providing vegan articles and recipes on the site based on audience interest.
Note that the Seasonal Affective Disorder article, while ranking top by volume of Sessions and New Users by far, received the highest Bounce Rate, close to 95%, as well as the lowest Average Session Duration at 20 seconds. The best performing article based on average session duration was 5 Tips to Reduce Inflammation, the only one out of the top 10 with a time over one minute. As you can see, the volume of traffic (Sessions) alone does not necessarily indicate the quality of a post; we need to also look at how long people spent on the site after reading a post.
So, when measuring the success of landing pages from Facebook, take into account multiple metrics. Look at popularity by traffic volume, but also look at the engagement level of the visitors those landing pages bring to the site.
But even the engagement metrics do not necessarily tell the whole story. To really understand the value of the Facebook traffic, we need to look at Goal conversions.
How Does Facebook Contribute to Conversions?
Sessions and engagement metrics are nice but, ultimately, you want to know if Facebook is adding value to your business. Let’s give another look to the above screenshot. In the far right two columns we see conversation data from people who landed on these pages from Facebook. Note that we selected a specific goal from the dropdown above the columns. In this case, we are tracking newsletter signups, valuable for getting people onto mailing lists to promote purchases of recipe books and other products.
Once again, we see the Seasonal Affective Disorder post ranks at the bottom for conversion rate out of these landing pages, despite receiving a high volume of traffic. The post on reducing inflammation, while receiving 16,000 fewer sessions, drove over 300 more conversions at almost 5 times the conversion rate (1.35% vs 0.30%).
In addition, the post on vegan Thanksgiving recipes, which has the best engagement based on bounce rate and pages/session, also shows the highest conversion rate at 1.7%. In this case, higher engagement correlates to a higher likelihood of conversion.
Based on this data, we should review these top performing landing pages, as well as the messaging on Facebook that drove users to them, to identify what worked. This review should help to guide future content planning and social posting strategies.
Beyond looking at conversions for specific landing pages, we should also look at the quality of Facebook in driving conversions when compared with other social networks. To do this, we return to the Channels report (Acquisition > Channels) and select Social to break down data by specific social networks. Once again, we select our newsletter signup from the dropdown above the conversion columns to look at data for that single goal.
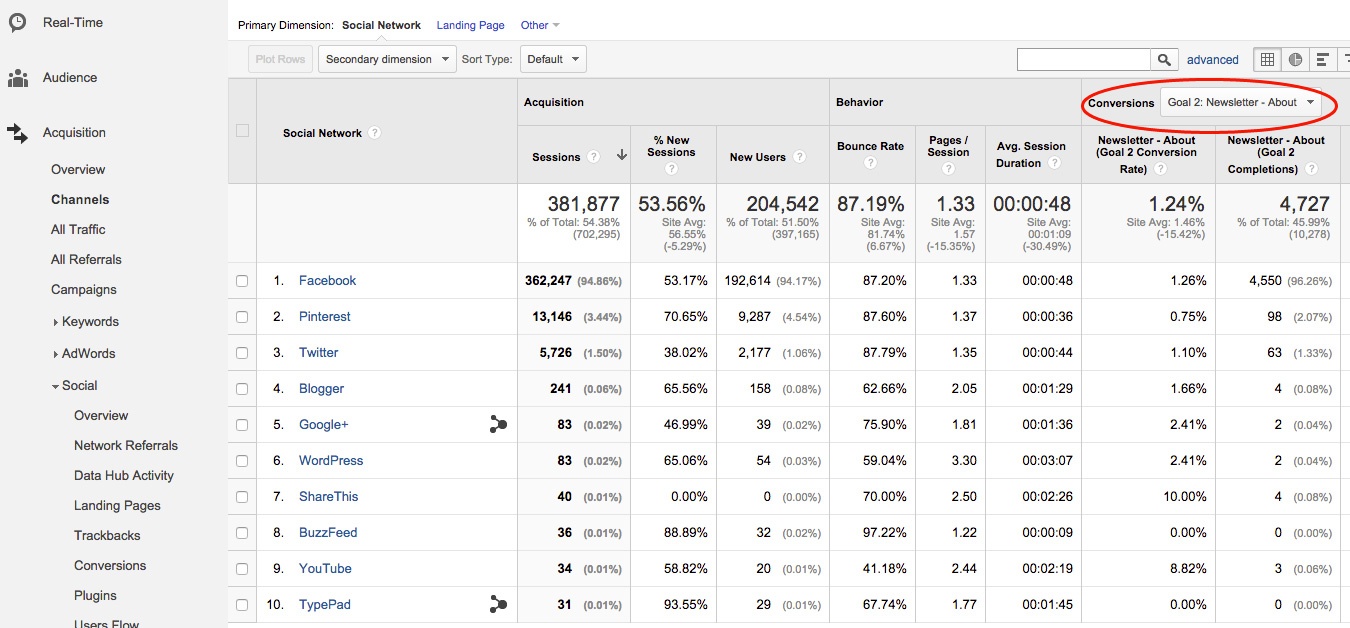
In this example, Facebook by far contributes to the most sessions and conversions. Also, note that the conversion rate on Facebook (1.26%) is higher than that of the two other major social networks contributing to sessions, Pinterest and Twitter. From this data, we can see that Facebook is the most successful major social network for driving conversions. Some other low volume networks such as Google+ show higher conversion rates, but the number of conversions is so low this data is barely statistically significant. To really measure the effectiveness of Facebook vs Google+, you would need to post more content – and drive more traffic – from Google+ to get a statistically significant amount of traffic. If you were getting at least, say 50 conversions from Google+, you could safely make the comparison.
Who Are Your Facebook Users?
Beyond sessions, engagement and conversion, you should also understand demographic data about users arriving on your site from Facebook. You should know how your Facebook users may differ from other audience types to help you tailor content to these users.
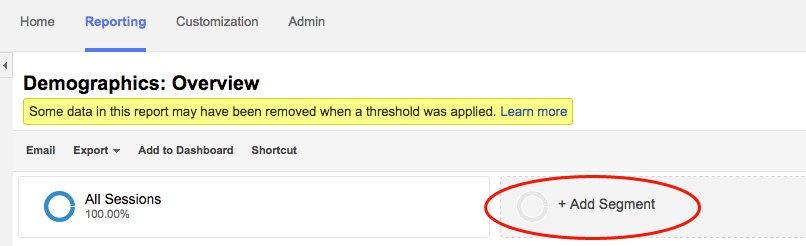
To look at this information, we will go to Audience > Demographics > Overview. Next we’ll create a segment to show data specifically for Facebook users. Start by selecting “Add Segment” right above the graph area.
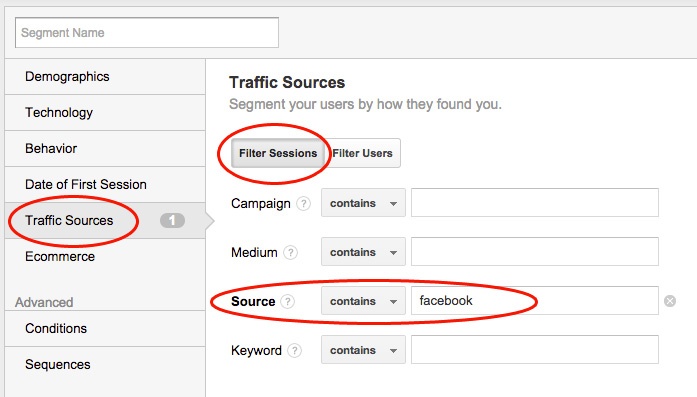
Next, select “New Segment” and choose “Traffic Sources” from the sidebar. Select “Filter Sessions” and enter “facebook” into the “Source” field.
Finally, name and save your segment. For this example, we’ll add our new Facebook segment and compare with the built-in All Sessions segment to understand that demographic of our Facebook audience relative to the entire audience.

Now, we see graphs comparing age and gender breakdowns for All Sessions (blue) versus Facebook visits (orange). Note that Facebook users skew more heavily in the 35-44 and 45-54 age categories than for the site as a whole. From this data, the content writers should take into account potential interests of those in these age ranges when writing for blogs and recipes that will see heavy Facebook promotion.
The Facebook audience is also slightly more female than the total audience (84.4% vs 83.3%) – although that difference is not as pronounced as the age-demographics difference.
Conclusion
Google Analytics allows you to see beyond Facebook’s own Insights to understand how users are interacting with your site after clicking a link from Facebook. Take the time to analyze not only how many sessions occur from Facebook but where people go on your site, how long they spend, how well they convert, who they are and how they may be different from other site visitors. Use this data to inform writing content and structuring your site to better serve these users.