
May 20, 2024
Understanding the Funnel Visualization in Google Analytics
By Megalytic Staff - August 18, 2016
Setting Up a Goal Funnel
When setting up a Goal in Google Analytics , you’ll see an option at the bottom of “Goal details” to create a funnel. Here, you can add the URLs for each step you want to track.
In this example, we’re setting up a Goal Funnel for a site selling tickets for local classes. The process entails placing an item in a cart and submitting a payment. The entire process covers multiple pages, and we want to be able to see each step separately and as part of the whole.
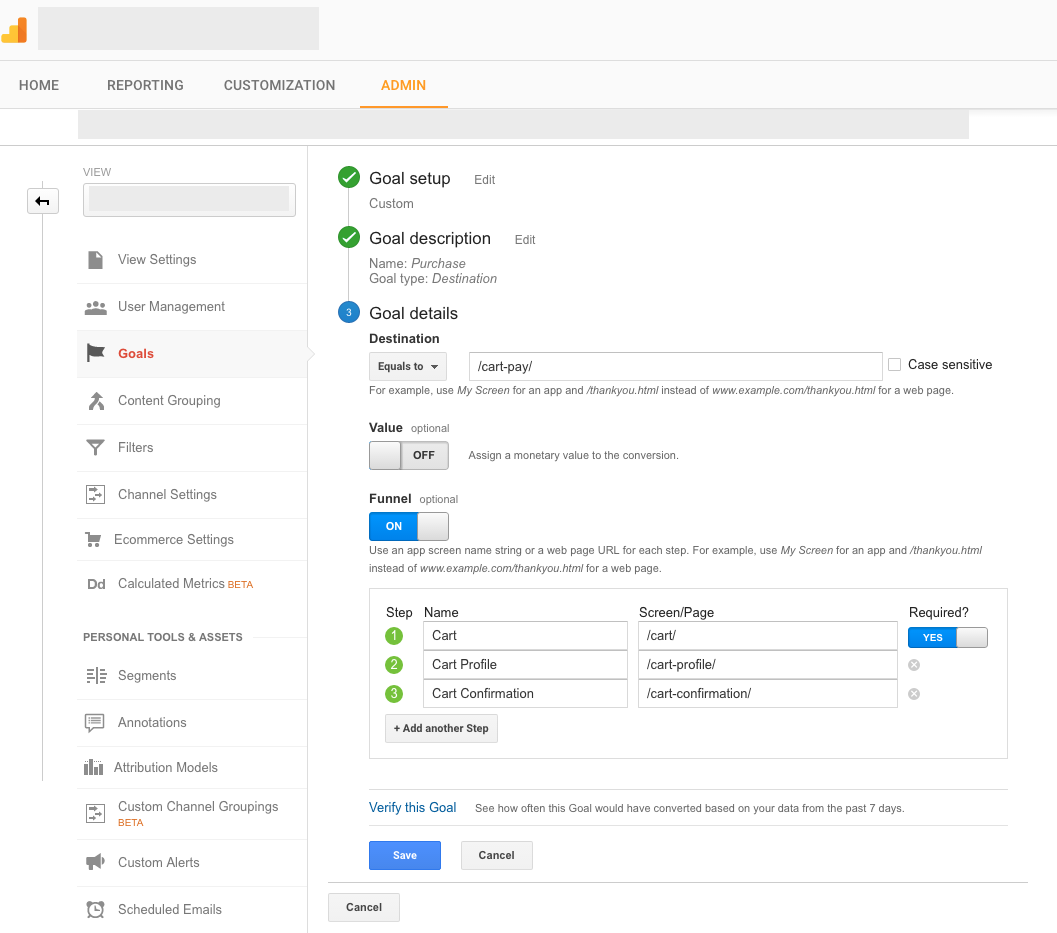
The final confirmation URL (in this case the page that appears after payment completion) goes into the “Destination” box under “Goal details.” Next, to create the Funnel, toggle the Funnel switch to the “on” position. You can now enter the sequence of steps that a user would take to get to the final payment page, providing page URLs with descriptive names that will appear in the report.
In this example, the user places an item in the cart (/cart/), goes to the cart profile page to enter personal details (/cart-profile/), and reviews a confirmation page (/cart-confirmation/) before pulling the trigger on the final purchase. If you turn the “Required” toggle bar on, Google Analytics will only count funnel entries that come in via the first step. With this option off, Google could count entries to the funnel from any later step, no matter how many previous steps the user skips.
Once you’ve saved your funnel steps, click Save, and Analytics will begin tracking entries from that point forward. You can edit the funnel steps at any time, but no retroactive data will appear in the report.
Understanding the Funnel Visualization Report
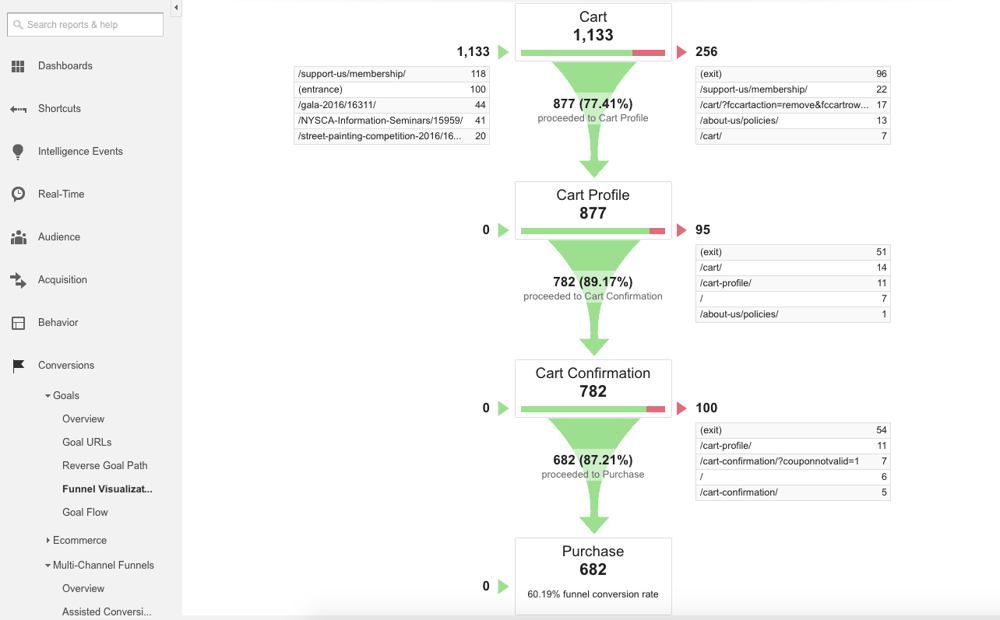
Once data starts accumulating, you can view performance under Conversions > Goals > Funnel Visualization. Here, we can see performance of the cart setup where class tickets are purchased.
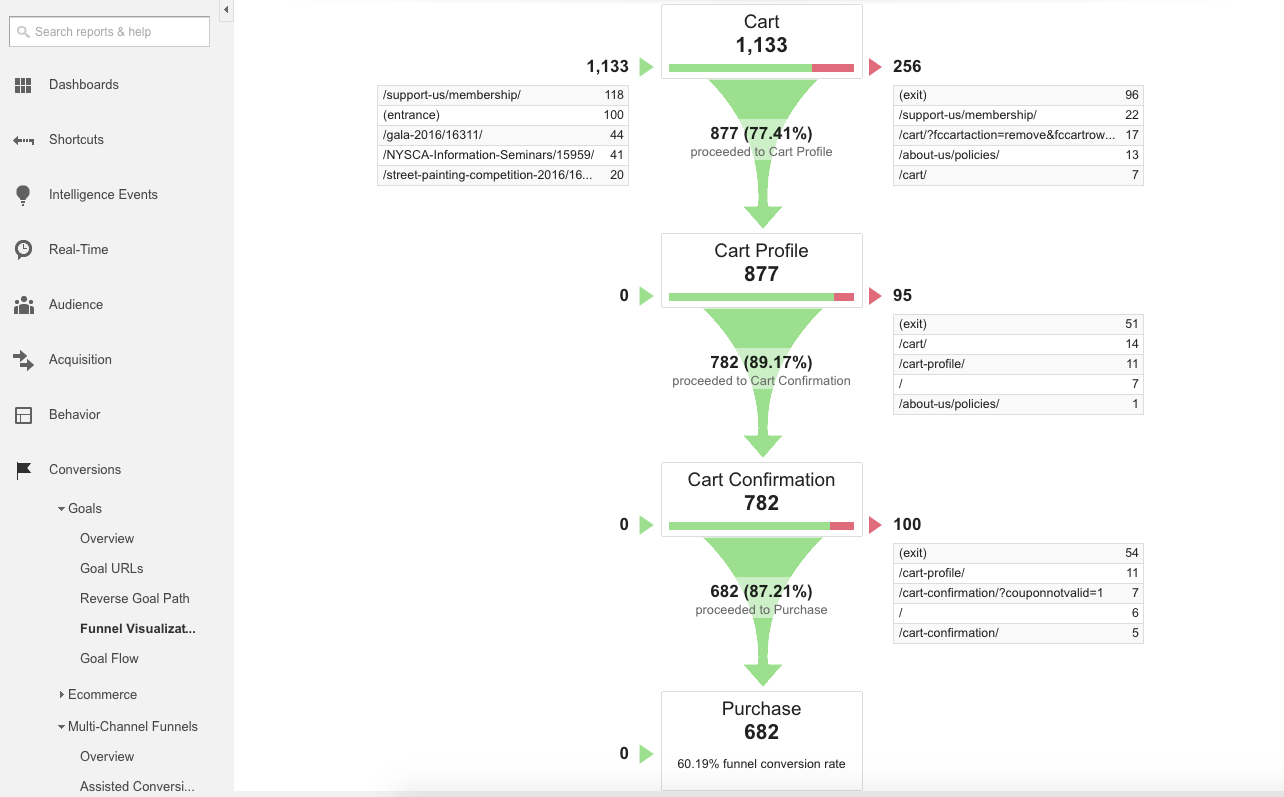
Each section of the funnel shows the percentage of people who continued to the next step, as well as a final funnel conversion rate at the bottom. The funnel conversion rate measures the percentage of people who entered the funnel and completed the final Goal. This metric is not the same as the main Goal Conversion Rate, which accounts for all visitors to the site.
In this example, we can see that 1,133 people entered the cart checkout process and 682 (60%) actually completed it. We can also see that the largest dropoff was from the initial Cart page, where people added a class to the cart.
To analyze why people actually dropped out, we should take a closer look at the cart process on the site. Was the next step not clearly labeled? Should there be a stronger call to action to move people ahead through the process? Was there a usability issue? Was a lengthy form potentially too intimidating?
In addition, look at pages where people went after dropping out of the cart. These are listed beside each stage of the funnel. In this case, many people seem to be jumping back to previous stages; for instance, going from the Cart Profile back to the initial Cart page.
Uses for Funnel Visualization
You don’t need to have a multi-step shopping cart on your site to take advantage of funnel visualization. You can set up funnels to measure how any page impacts the final completion of conversions. Simply enter the pages in the order you want to track them as funnel steps when setting up a goal.
For example, if you’re promoting a newsletter signup from a form on your blog, you can create a goal funnel measuring how many people go from the /blog/ section of your site to the conversion page. For instance, promoting college admissions inquiries would mean measuring how many people go from the /admissions/ section of your site to complete a form asking for more information.
Since Google Analytics by default calculates the Goal Conversion Rate off of the total number of Sessions to the site, you can also use a funnel to calculate the conversion rate of people who viewed a specific page. For instance, you can see what percentage of people view a Contact page and actually complete the form on that page.
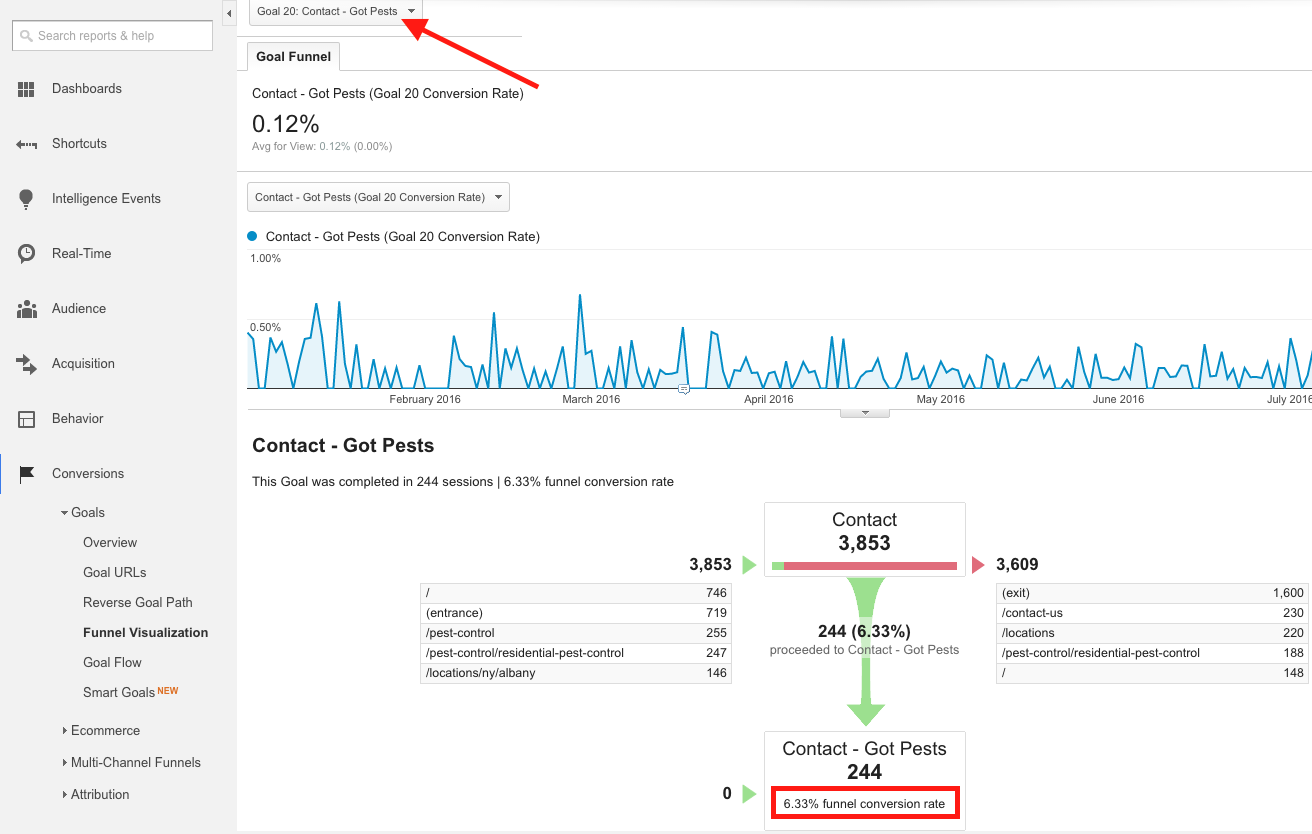
In this example, we’re measuring conversions for people who visited a contact page on a pest control site and completed a form indicating interest in service. First, note how we selected our desired form from the dropdown at the top. Next, we can see that the overall conversion rate is just 0.12%. However, this doesn’t accurately reflect the effectiveness of the form, as people have many other options to convert on the site.
Further down, we can see the final results. 6.33% of people who visit the Contact page actually complete the form and indicated that they need help with pests. People on this page have other options, including asking questions about a bill as a current customer, so this conversion measures the most lead-focused form submission from this page.
Conclusion
The Funnel Visualization report allows you to take a step beyond simply looking at total conversions and overall conversion rate as a part of website performance analysis. When setting up a conversion to track, be sure to think about all of the funnel steps that you can also track in the process.
A football player never gets better by only watching the game tape from the times they won. The real lessons come from reviewing our losses, and asking what went wrong and where can we do better. Funnel visualization is your game tape.
This report excels at helping to locate possible usability issues and identify opportunities for conversion rate optimization. Ideally, like any report in Analytics, the end result should be the guidance you need to improve lead generation and sales.