
May 20, 2024
Updating Your Report Templates with New Data Each Month
By Megalytic Staff - September 29, 2017

Example of a Monthly Report
Let’s say your marketing department wants to track some basic metrics each month, comparing them with historical results. They also want to see detailed analytics on the top campaigns – and these campaigns may change each month.
Here is an example of this type of report: Digital Marketing Report – September .
The first three charts/tables are the standard metrics with historical comparisons:
- Key Metrics – Compared with Last Month
- Daily Traffic – Last 6 Months
- Top 10 Campaigns – September 2014
These can be automated because they are the same each month. The data and the date ranges in these charts/tables may change, but their definitions are the same.
But, what about the next three?
- Campaign – Football Team Sales Event
- Campaign – Fall Sales
- Campaign – Act Now Email
These tables dig into the data for three specific campaigns that the company ran during the month. They were chosen for deeper analysis because they are cross-channel and/or generate a lot of traffic. These campaigns had high visibility with the marketing staff during the month, and you wanted to call them out.
This group of tables will change each month. You need some flexibility and discretion in choosing which campaigns to include. To “set and forget” this would be a disservice to your team or your client.
Megalytic Templates let you automate the portions of the report that repeat from month-to-month, while retaining the flexibility to update the campaign statistics to reflect the new campaigns that roll out.
Megalytic Templates
To ease the hassle of monthly reporting, Megalytic lets you create a report once, and then save it as a template. Once saved, you can recreate that report and modify as required to meet the changing needs of the business.
Here’s how you do it.
Want to try this with your own data? Create a Megalytic account here: Free 14 Day Trial .
Step 0 – Create the September Report in Megalytic
Since this is a short blog post, we aren’t covering the process of creating the report in the first place, but it’s not that hard and you can see how it is done here: Getting Started with Megalytic and Creating a New Report .
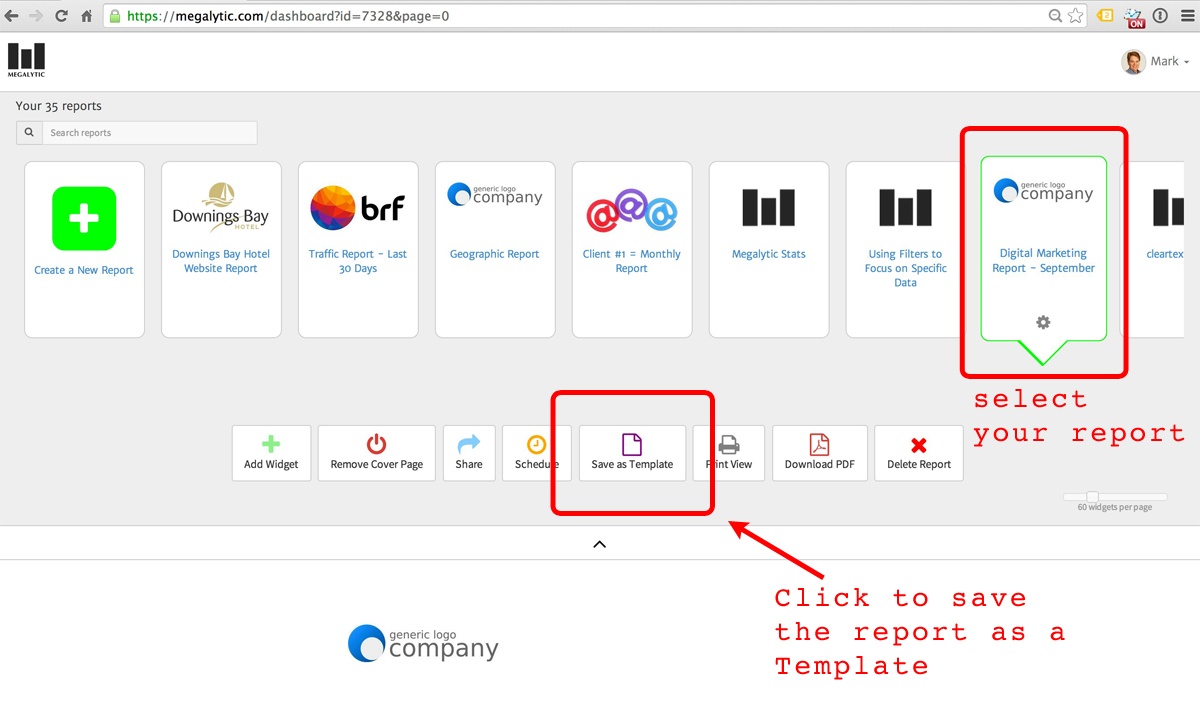
Step 1 – Save the September Report as a Template
First, select a report you have created in Megalytic. In this case, we have chosen the Digital Marketing Report – September . Next, click on “Save as Template.”
Follow the prompts, and give the template the name “Digital Marketing Report – Monthly.”
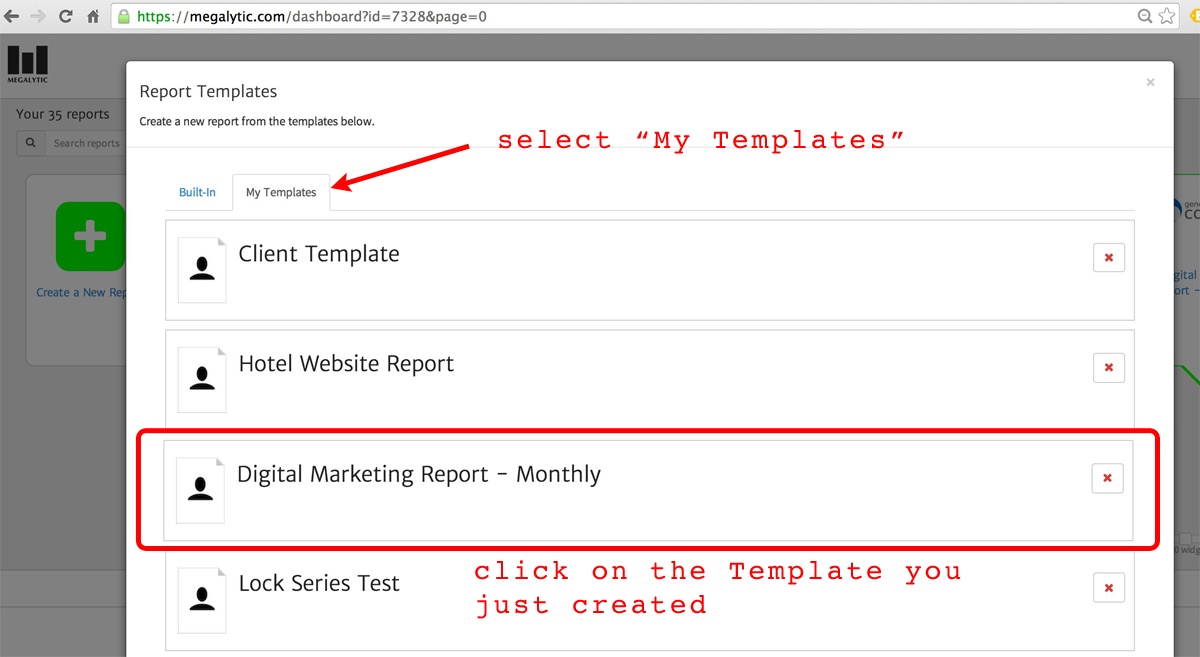
Step 2 – Use the Template to Create October’s Report
It’s a new month and it’s time to create your October report. Why start from scratch?
To create the October report, start by clicking “Create a New Report” on the left side of the Megalytic dashboard. When the template picker opens, click on the tab labeled “My Templates” and select the template you just created – “Digital Marketing Report – Monthly.”
Upon clicking this, Megalytic will automatically build a new October report from the existing template. You will want to update your cover page (in this example, updating the cover to say “October”, rather than “September”) and change the text as desired. Usually, people use the cover page to give a short introduction to the contents of the report. Think of it like an executive summary.
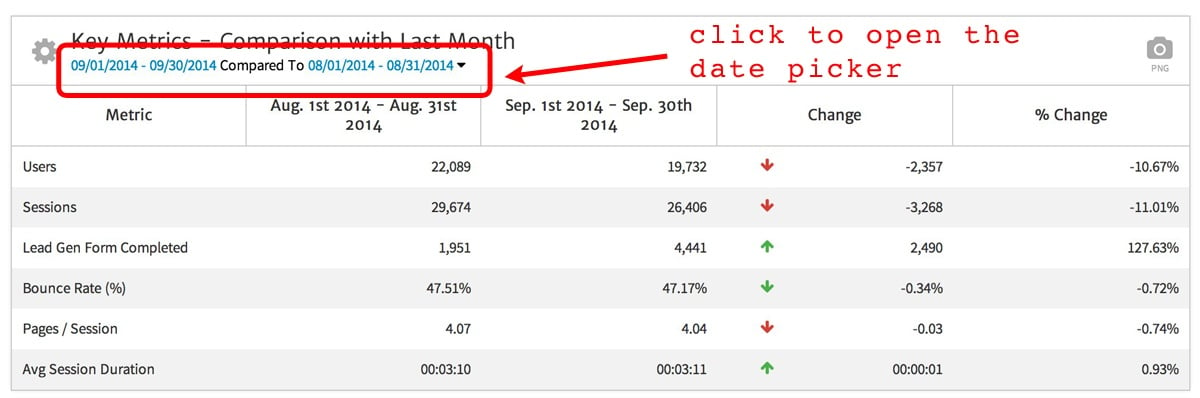
Step 3 – Update the Date Ranges of the Widget
To update the date ranges in this October report, start with the first widget – “Key Metrics – Comparison with Last Month,” and click on the date range to open the date picker.
Select October as the current period and September as the previous period. Click “Apply.”
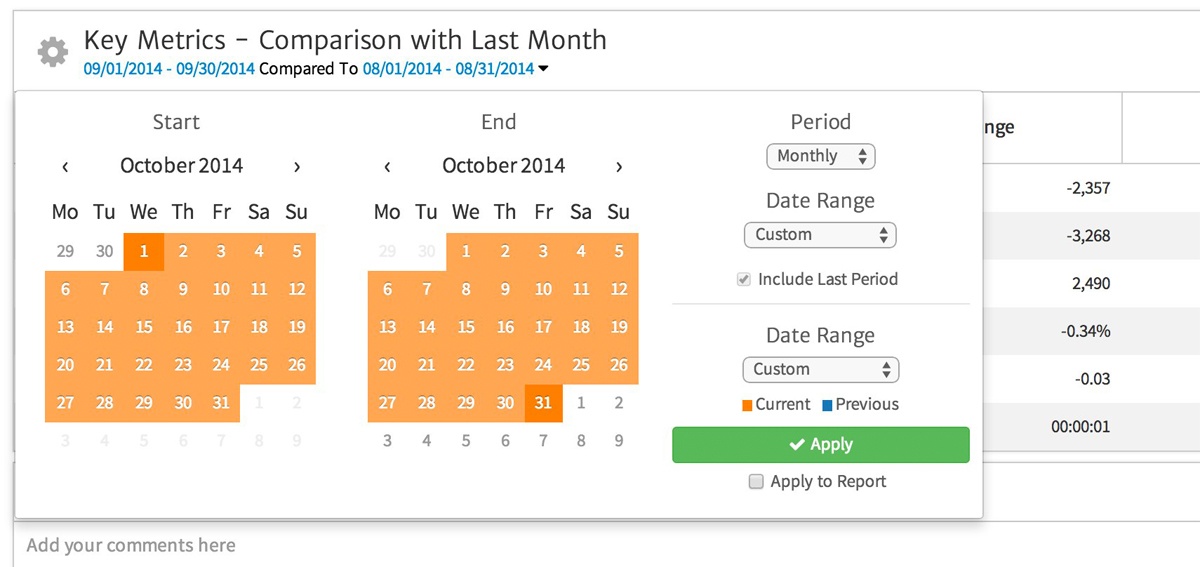
Now, go through the other five widgets in this report and update the date ranges similarly.
Step 4 – Select New Campaigns for the Last Three Widgets
In the September report, we highlighted three campaigns:
- Football Team Sales Event
- Fall Sales
- Act Now Email
For October, we want to change the campaigns highlighted in these widgets. To do that, we make use of Megalytic Filters .
Suppose that the first October campaign we want to highlight is “BlowoutSale.” We will convert the widget that currently displays “Football Team Sales Event” to show the “BlowoutSale” campaign instead.
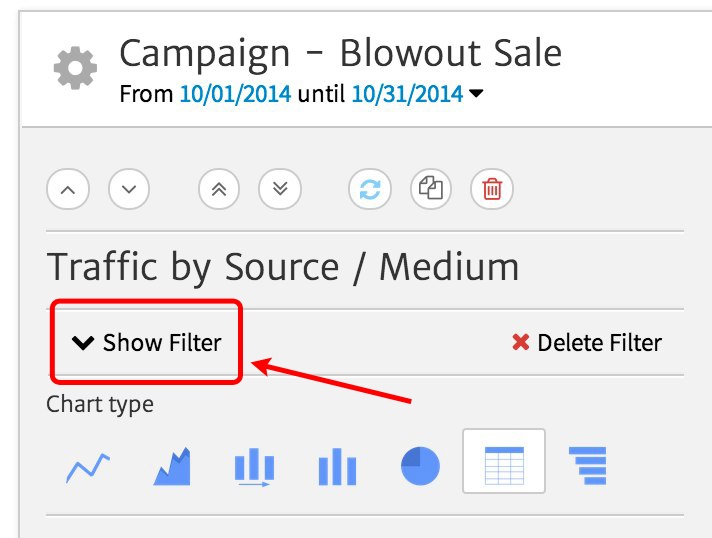
First, we change the title of this widget to “Campaign – Blowout Sale”. Then, we open the widget editor and click on “Show Filter” to open the filter that selects the campaign.
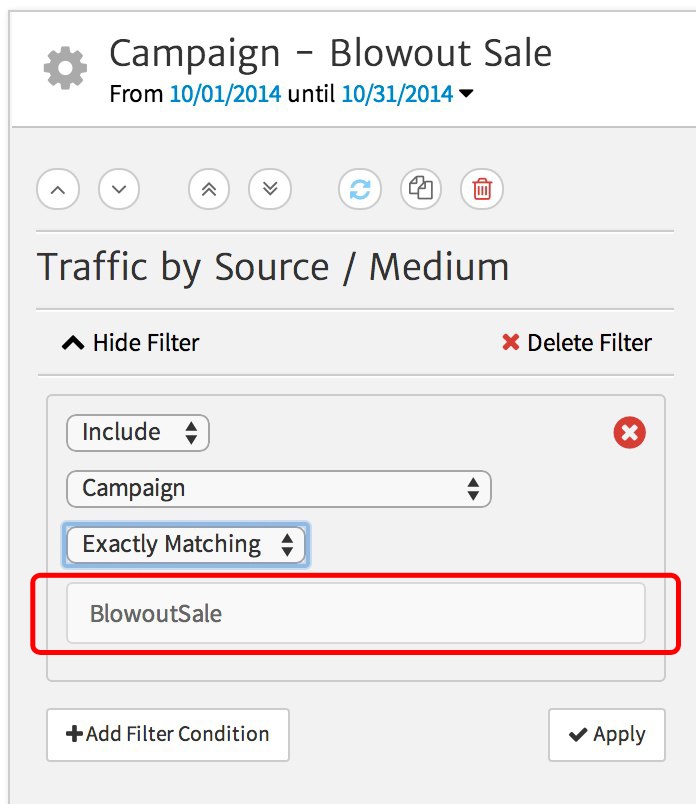
Next, enter the campaign code “BlowoutSale” in the filter and click “Apply.” The widget will now show the data for the new campaign.
To finish up, we update the other two Campaign widgets to show the details for the specific campaigns we want to highlight for October.
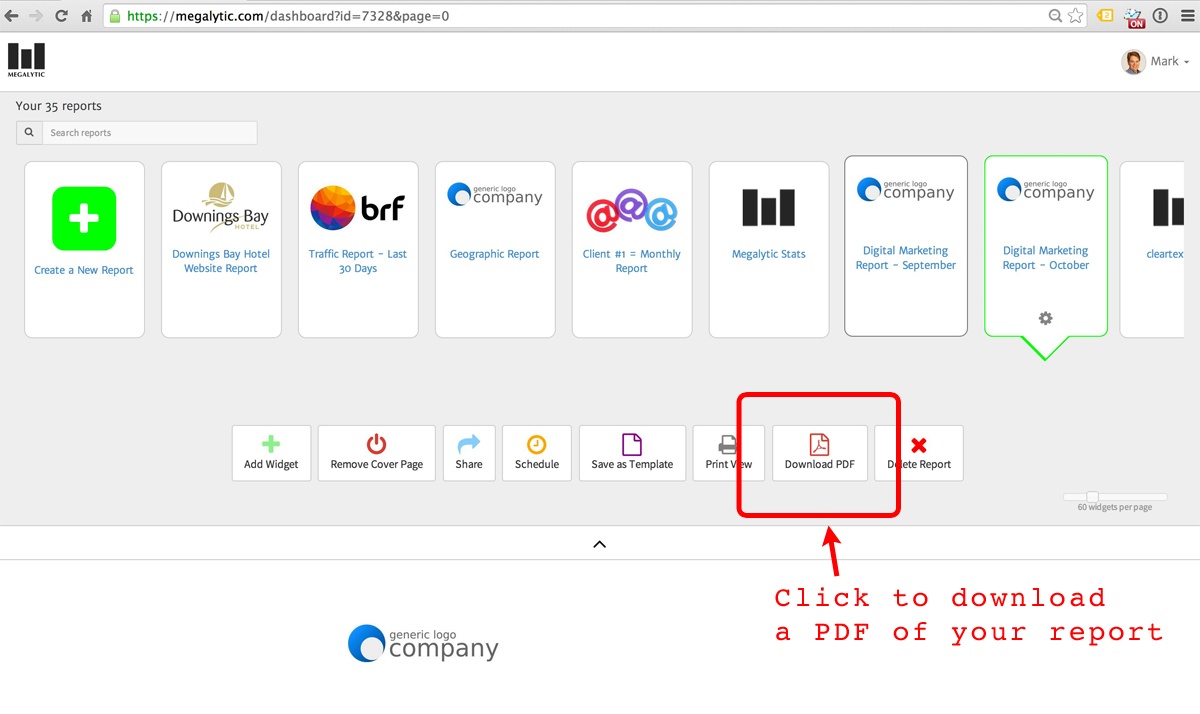
Lastly, we update the comments to highlight the insights we have gleaned from this month’s data. That’s it. The report can now be downloaded as a PDF: Digital Marketing Report – October .
Conclusion
Monthly reporting can be challenging to automate because the reporting needs of our clients and colleagues change over time. As illustrated in the example here, the October report is similar to September, but the campaigns have changed. With Megalytic templates, you can automate the repetitive components of the report, while retaining the flexibility to update specifics like campaigns. This style of automation is not completely “hands-off,” but is still much faster than exporting data to Excel, re-building custom charts and tables, and pasting into Word each month.