
May 20, 2024
An Example Facebook Report Template for Agencies
By Megalytic Staff - March 26, 2018
Key Performance Indicators (KPIs)
Your report should begin with KPIs (key performance indicators) that summarize Facebook performance for the month. You can use Megalytic's Multi-KPI Widget to display up to 4 metrics, together with comparisons to previous periods. Comparing with the previous month (month-over-month) and the same month last year (year-over-year) indicates whether the KPIs have improved or worsened over time.
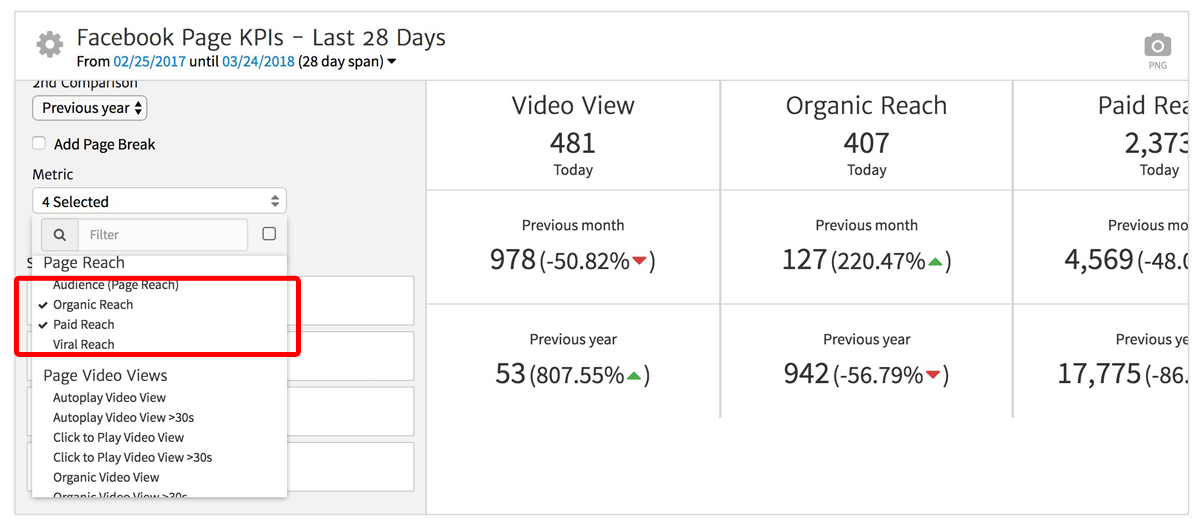
These are metrics from Facebook Page Insights and they report on the performance of the content owned by a Page (e.g., posts). Here we are showing, in the top row, metric values for the last 28 day period. Facebook reports many of its Page Insight metrics using a 28-day window. This example shows the client’s metrics for the last 28 days compared with the last 28 days one month ago, and the last 28 days one year ago. Reading this table shows that video views are down 50.82% from last month, but up 807.55% since last year. This client may have hired you to create video content for the Facebook Page, and, if so, the increase over last year is good news to report.
The red box shows how metrics are selected. There is a drop-down picker that lets you choose up to 4 Facebook Page Insights metrics.
Widgets like these are highly customizable, so you can tailor the presentation of data to meet the specific needs of your agency. For a quick summary of how to do these customizations and save the results to a template, watch this video.

Facebook Ads KPIs
If you do advertising on Facebook, as well as manage the client's Page, you should also include KPIs based on data from Facebook Ads. Megalytic has two sets of widgets - one for Facebook Ads and the other for Facebook Insights.
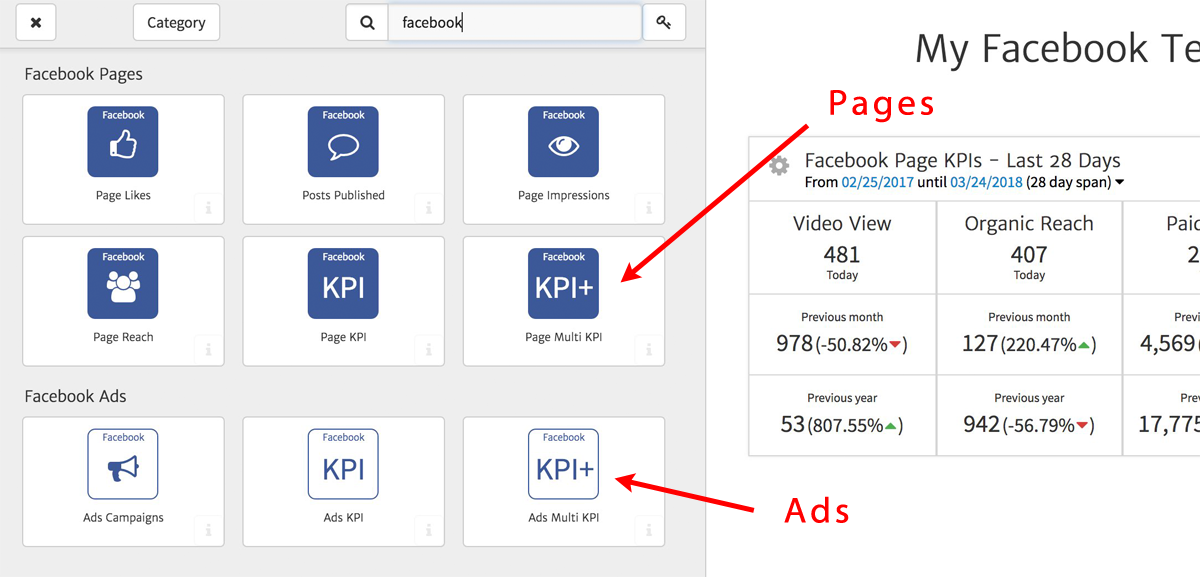
Widgets in the Megalytic Widget Library are color-coded and organized by data source. For Facebook, the dark blue background signifies Page data. The white background is for Ads data. When you drag the "Ads Multi-KPI" widget on to the report page, you will get a set of APIs reported from the Ads data.
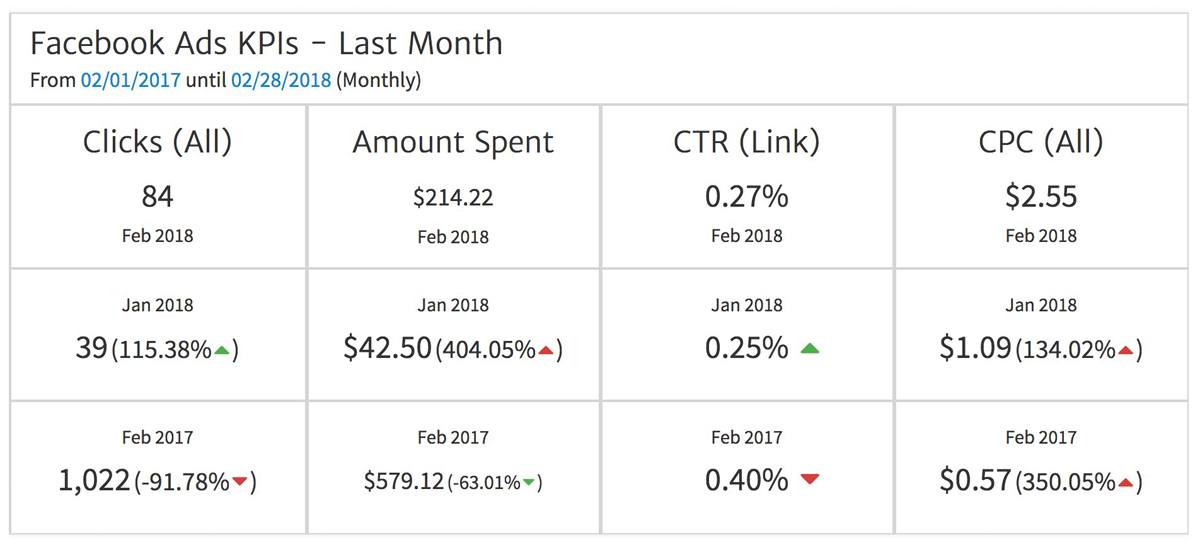
Here, we have selected Clicks, Amount Spent, CTR, and CPC as the KPIs to display for the client's Facebook Ads. But, you can select whichever Facebook Ads metrics are most important for measuring your client's success.
KPIs for Individual Facebook Campaigns
You can also show your client campaign level KPIs using the same widget, but with a single campaign selected. Here, we have selected the campaign "Megalytic Trial Promotion" using the widget editor.
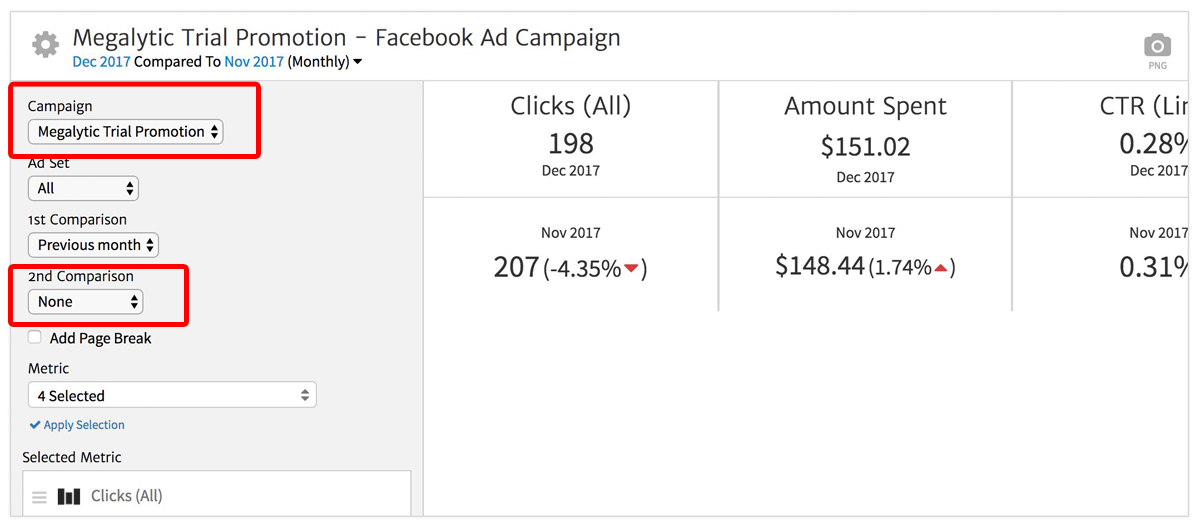
Note that we have also elected to display only a single comparison date range - "Previous Month". Sometimes, it is better to show less data, rather than more, to keep things simple for the client and not overwhelm them with information. If your client only cares about performance relative to last month (or last week, last quarter, etc.), then you can adjust the widget to display only a single comparison.
Display Trends in a KPI with Sparkline Charts
In addition to showing the KPI numbers, sometimes you want to provide a little bit more information, like an indication of the direction that the metric is trending. Single KPI widgets include a small chart, or sparkline , in addition to the date range comparisons.
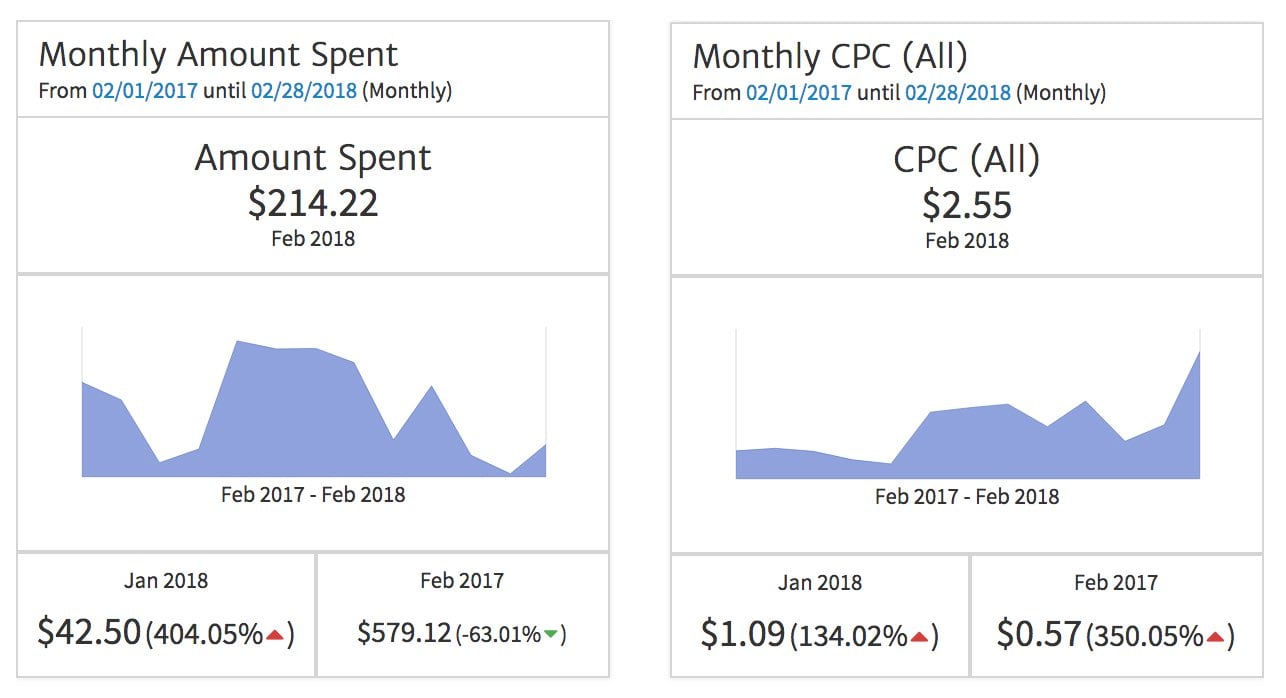
Here, we see two single KPI widgets providing data about spend and cost per click (CPC). This client's spending on Facebook Ads peaked in mid-year and has tapered off, while their CPC continued to rise,
Comparing KPIs Across Campaigns
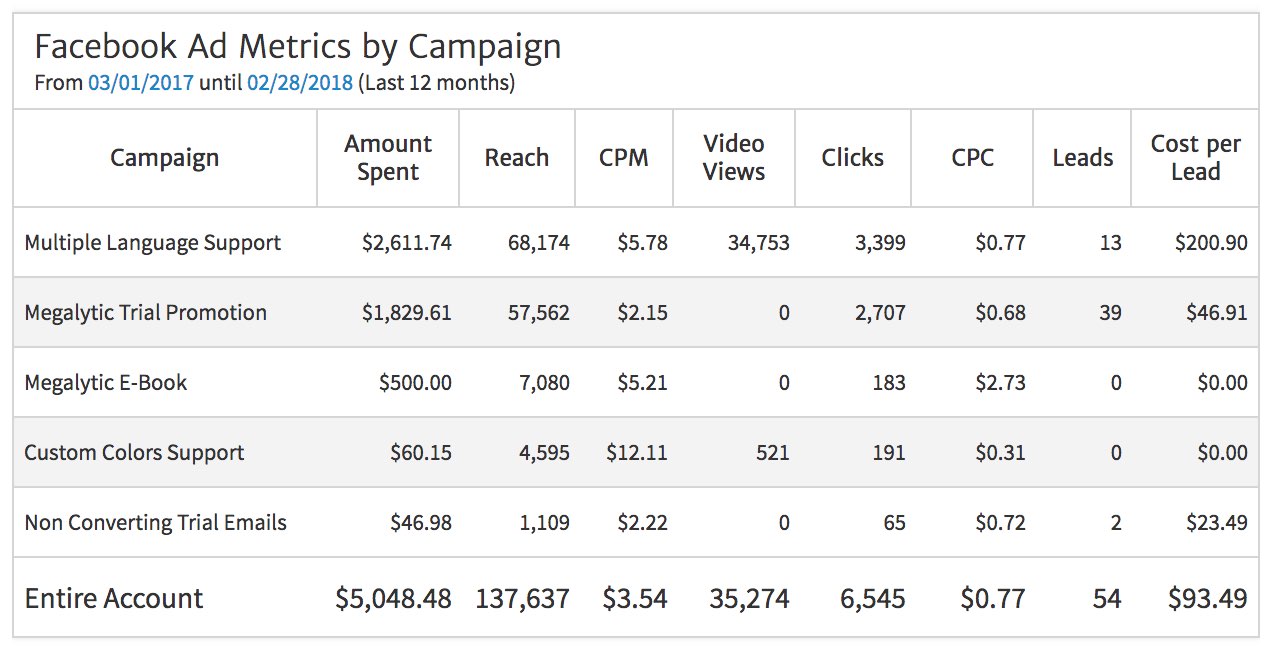
Finally, you may want to wrap up the KPI section of the report with a comparison across all the Facebook Campaigns that your client has been running.
A table like this does not include date range comparisons (it is already densely packed with information). Instead, the objective is to provide your client with a read on many important metrics across all the campaigns at once. This enables you to easily see which campaigns are outperforming, and which need to be optimized
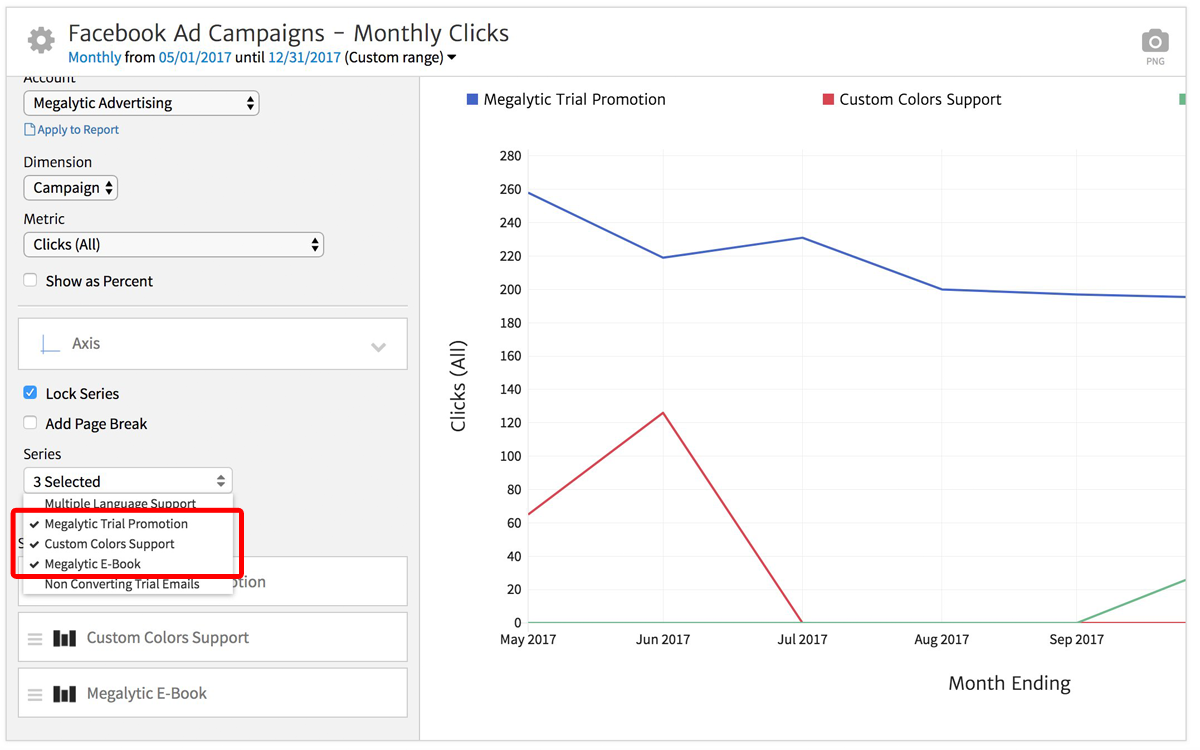
Sometimes, your client may want to compare the performance of multiple campaigns over time. This kind of chart uses a single metric (e.g., Clicks), and plots a line for each campaign showing comparative performance. By default, Megalytic shows you the top 3 campaigns, but you can select precisely the campaigns that you want to appear in the chart by using the widget editor.
Facebook Page Posts
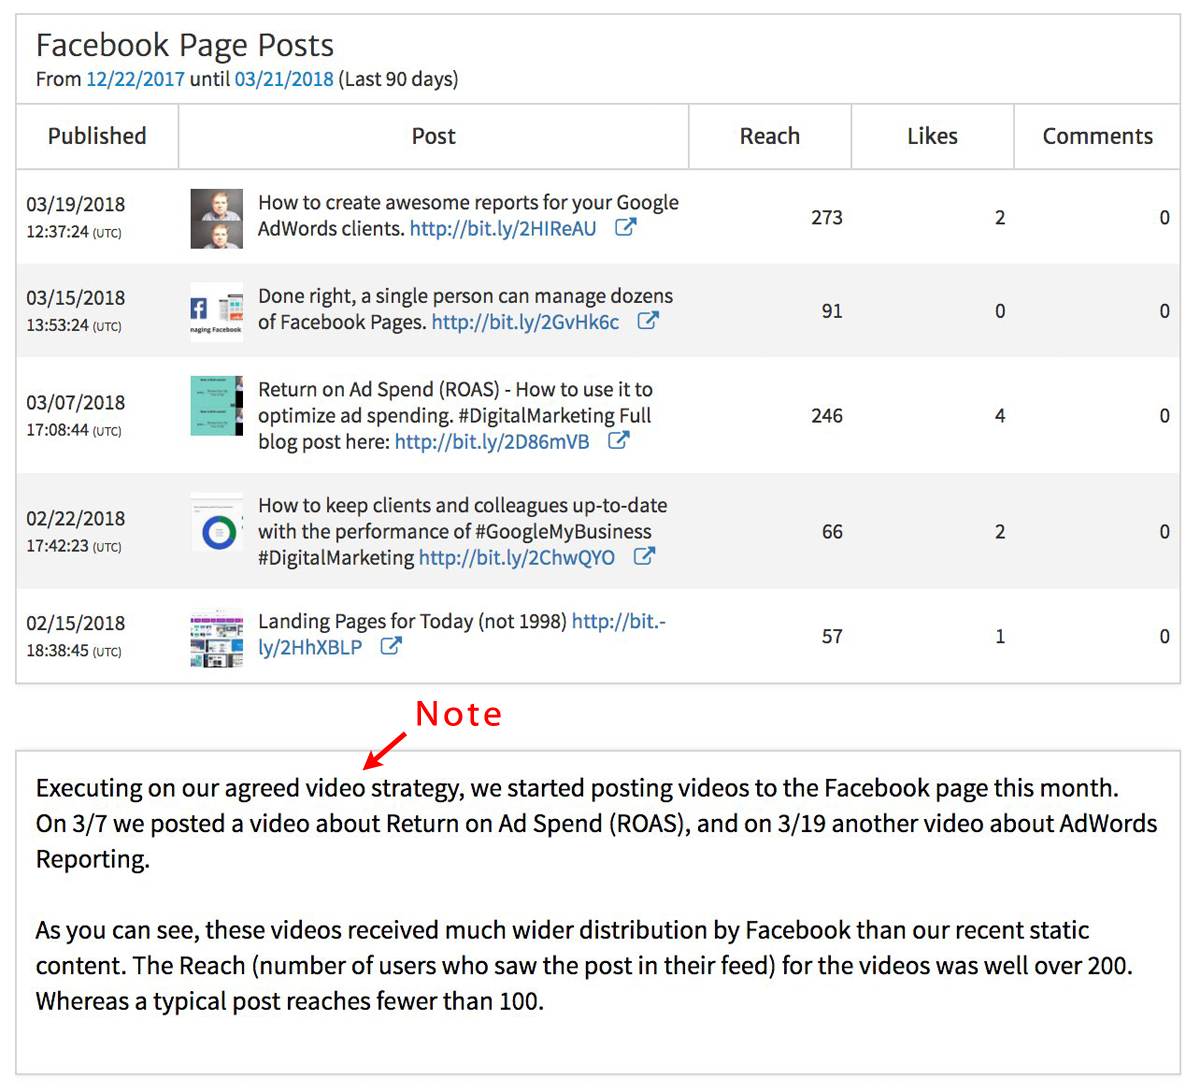
After presenting the KPIs, it makes sense for your report to move on and talk about the social media posts that have been made recently on the client's Facebook Page. Using Megalytic's Posts Published widget, you can provide a chronological listing of the recent posts, together with thumbnail images and some important metrics. Here, we have decided to display the metrics Reach, Likes, and Comments.
Using Text (Notes) to Explain the Data
Generally, it is a good idea to meet with your client by phone or video conference to review the report. Send the report prior to the meeting, and include text describing the numbers and charts in the report. This makes it easier for your client to connect the dots between the digital marketing strategy you agreed on and the results from the work that you have performed over the last month.
Megalytic's Notes Widget lets you enter free-form text in between the graphs and charts in order to include this type of explanation. As shown above, after the table of Facebook posts, you might include a note that describes the impact of your new video strategy.
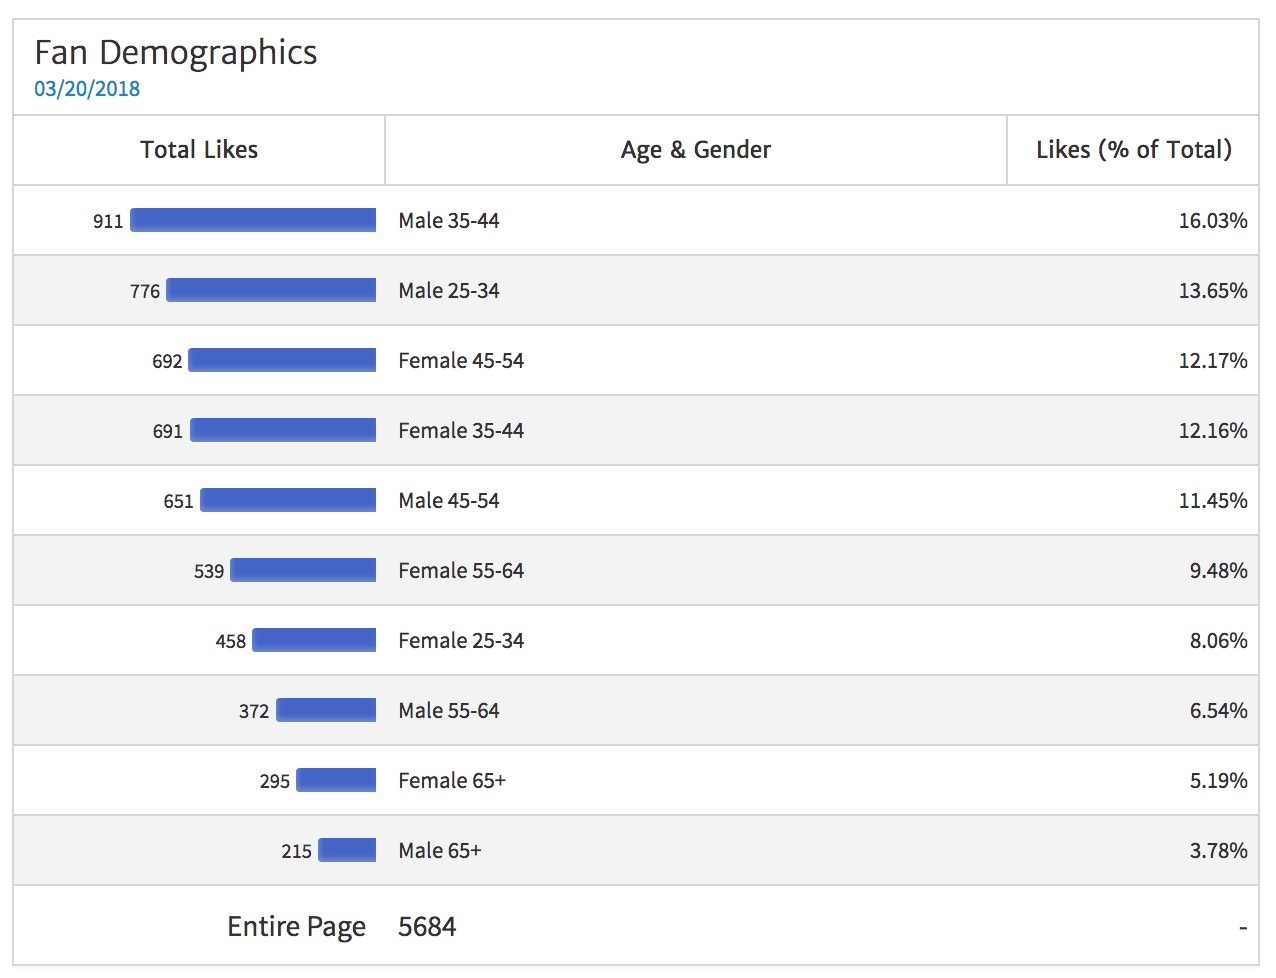
Fan Data
You'll also want to include information about the client's Page fans (Fans are people who have liked the Page). Information such as demographics (age and gender), as well as the location of fans can help your client understand their audience. More specifically, it can answer the question, "Does your Facebook Page audience match the demographics that your brand is targeting?".
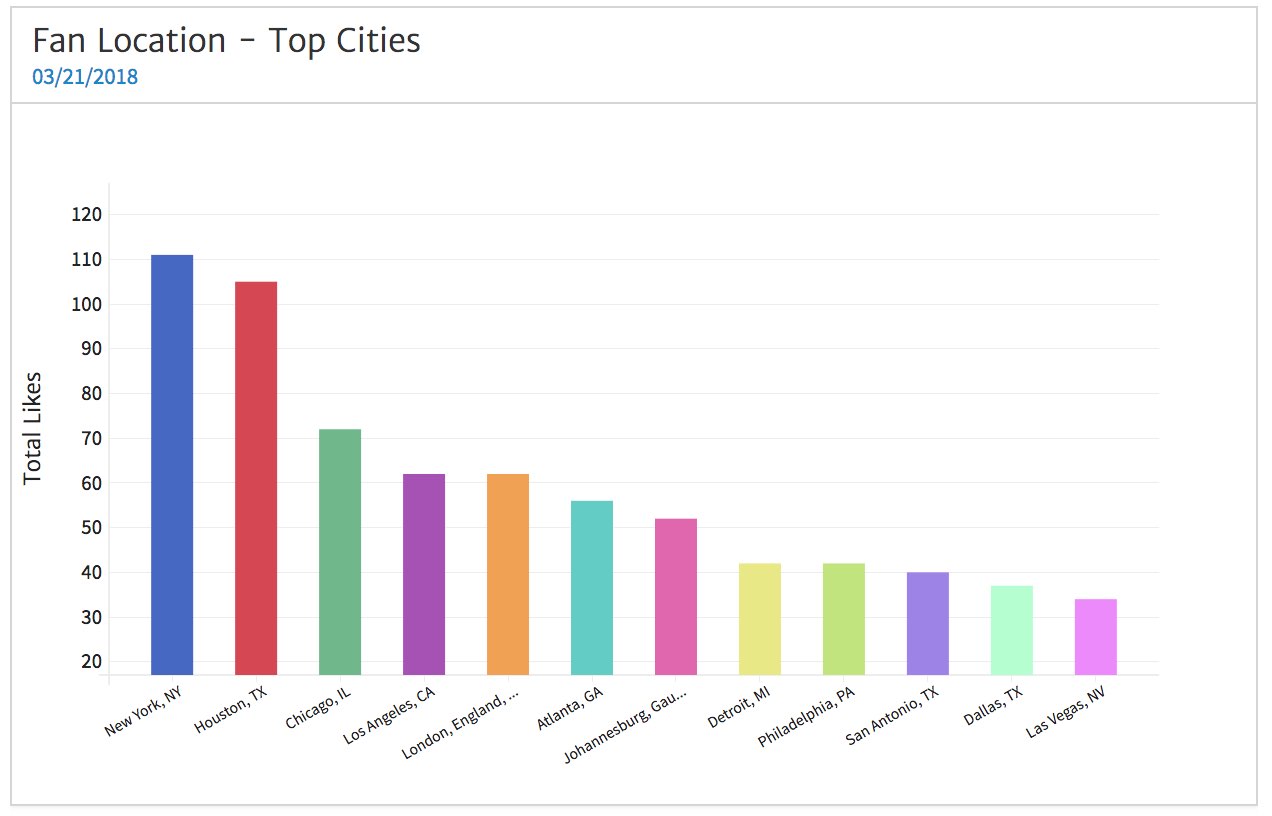
A bar chart showing the top cities where fans come is also a popular graph with clients. This helps them to see if their message is reaching the correct markets. For example, a restaurant chain serving the north-eastern USA would expect to see a large share of fans coming from New York and Boston. An unexpectedly good showing in Chicago, where they have no restaurants, might indicate an expansion opportunity.
Ad Level Data
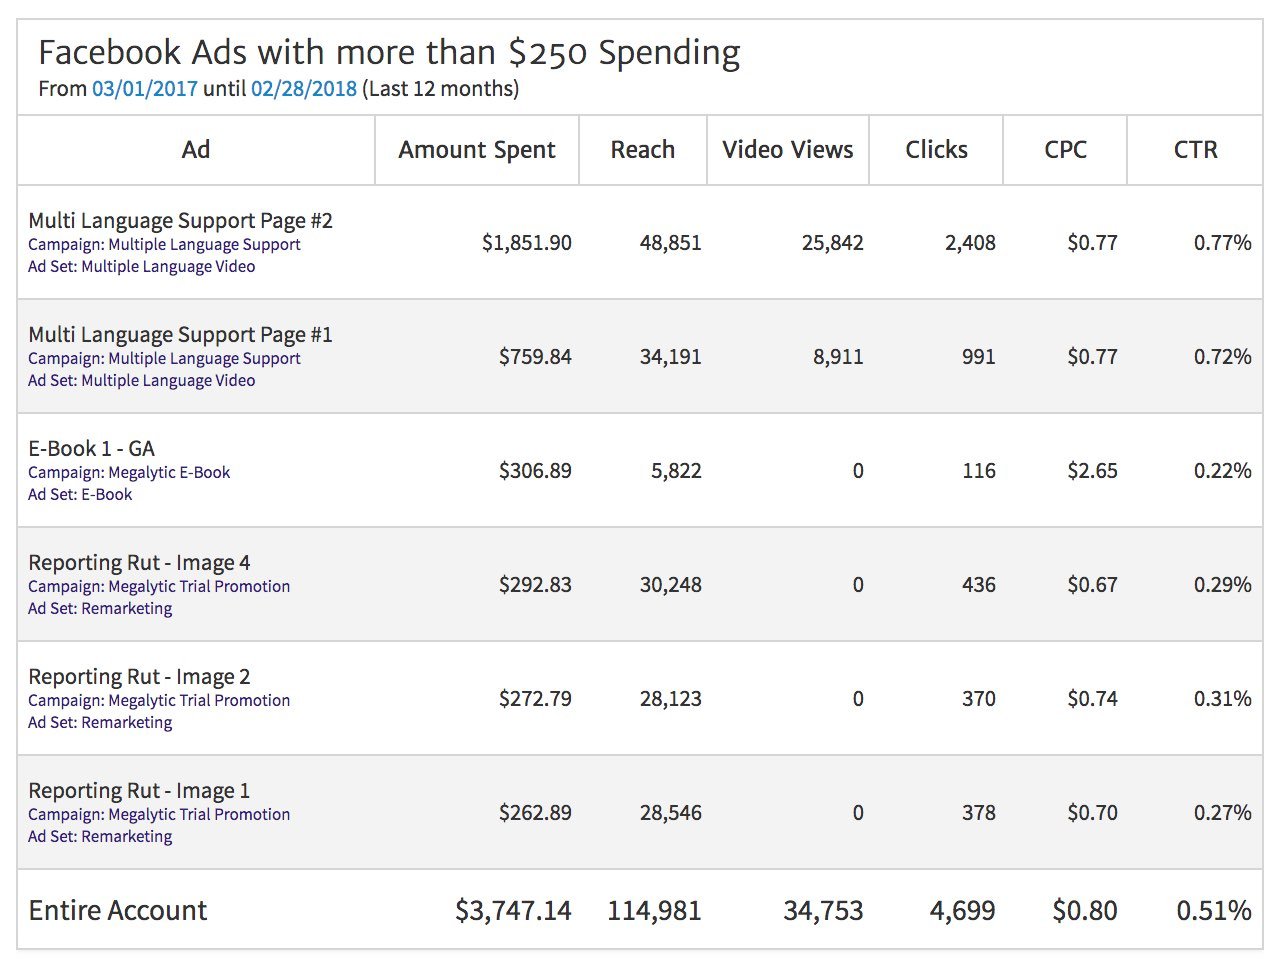
Depending on how detail oriented your client is, they may want to see individual Facebook Ad level data. With Megalytic, you can show advertising metrics at the Campaign, Ad Set, and Ad levels. When displaying data at the Ad level, you can also (optionally) show the Campaign and Ad Set that the Ad belongs to.
In this example, we have filtered the data to show only those Facebook Ads that have received at least $250 in total spending. Filters like this are helpful for removing clutter and only showing the data having the largest impact.
Ad level data can also be displayed in time-series. For example, if your client would like to see daily spending, broken out by Ad, you might present a chart like this one.
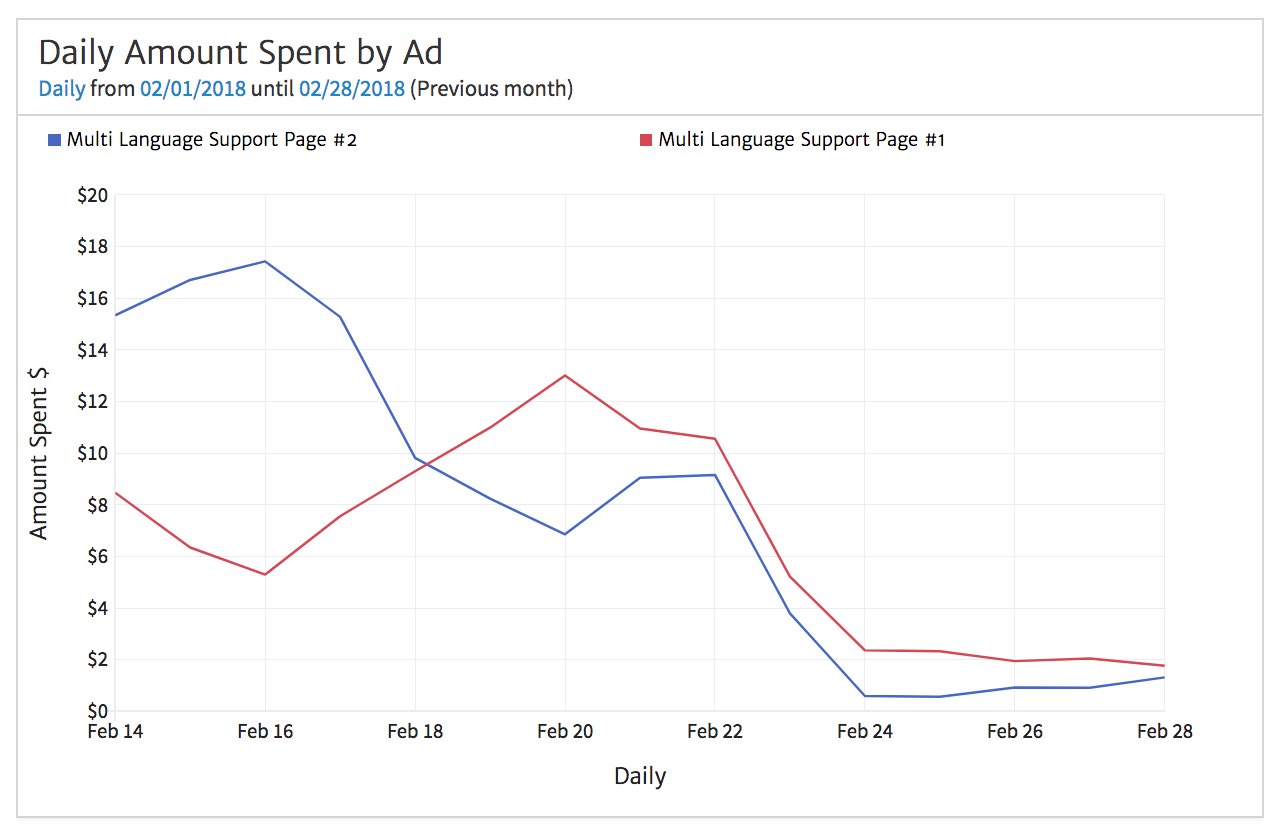
Although this shows data for only two Ads, you can select and display more. You can also pick different time periods for the time series. Here we have shown daily data, but it is also possible to chart weekly, monthly, and even quarterly data.
Month over Month Comparison for Ads
In addition to reporting on Ads over a fixed period of time, you should also provide your client with some data on how Ad performed compared with last month. A month-over-month table shows the performance of a particular metric, along with the absolute and percentage change.
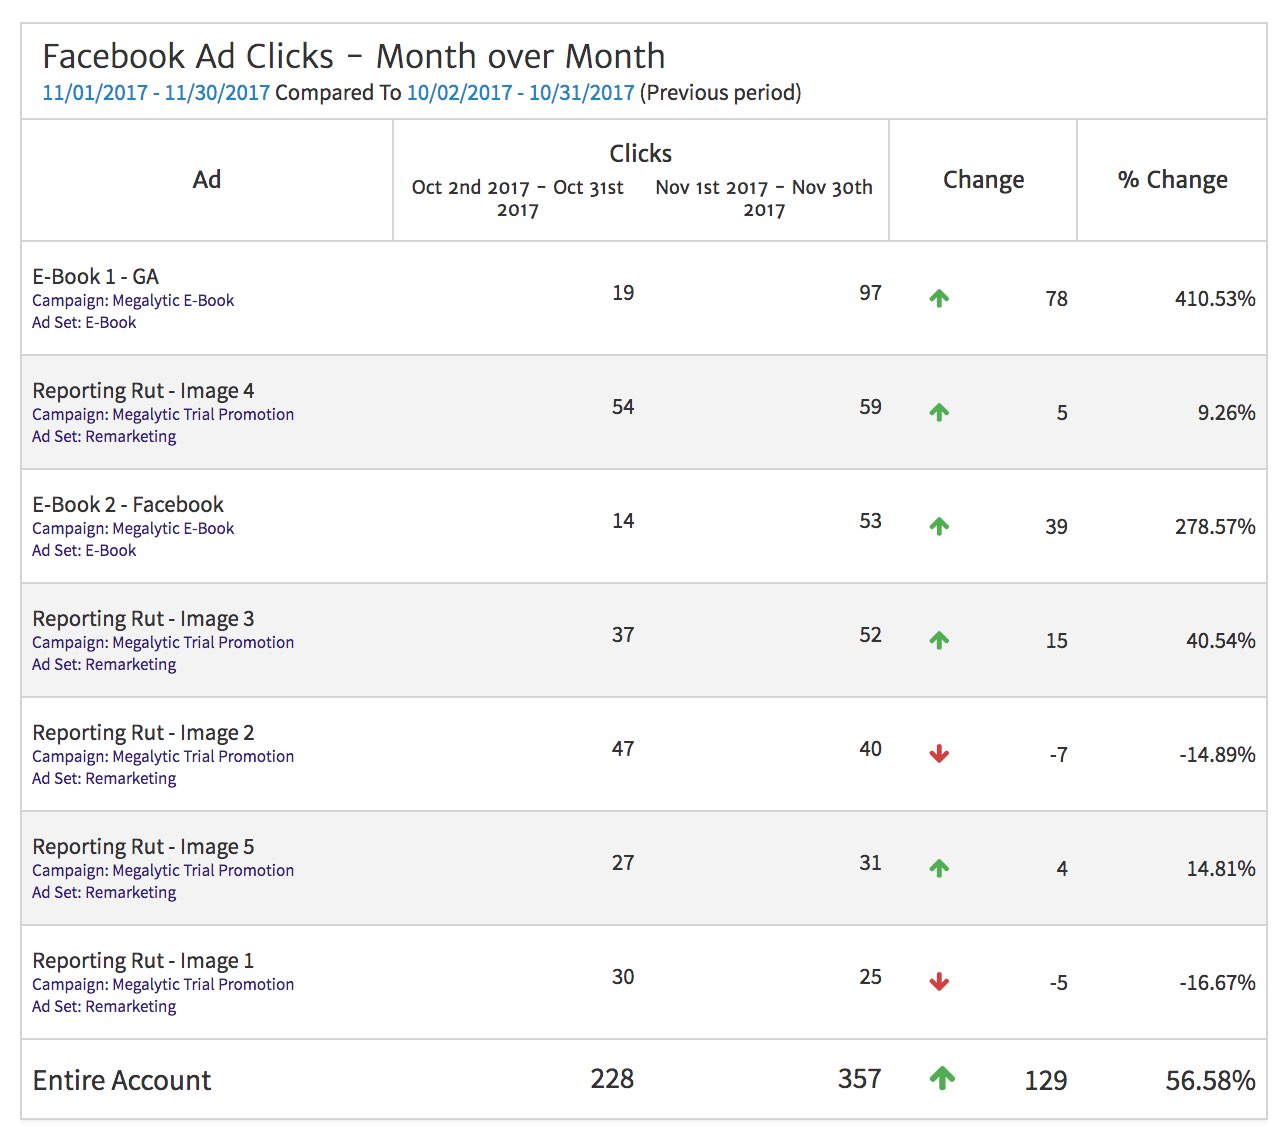
Here we can see at a glance that there were big increases in Clicks on the "E-Book - 1" and "E-Book - 2" Ads. After a table like this, you should probably include a note describing what change drove this increase. Was the budget for the "E-Book" Ad Set increased? Or did we improve the CTA (call to action) in the Ad? Or did we run the Ads for more days this month than last month? Sometimes the data raises more questions than it answers. That's why it is usually a good idea to meet with your client to review the report and answer their questions.
Saving and Re-using your Template
Continue adding and editing widgets in your report until you think that it represents a pretty good baseline. That is, it contains the base data the most clients care about. This report will become your template and provide a starting point for creating reports for all your clients.
To turn this report into a template, simply click on the "Save as Template" button from the Megalytic menu bar.

When you save your report as a template, you should provide a memorable name and a description (optional). That's all there is to it. You can now start from this template whenever want to create a new client report.
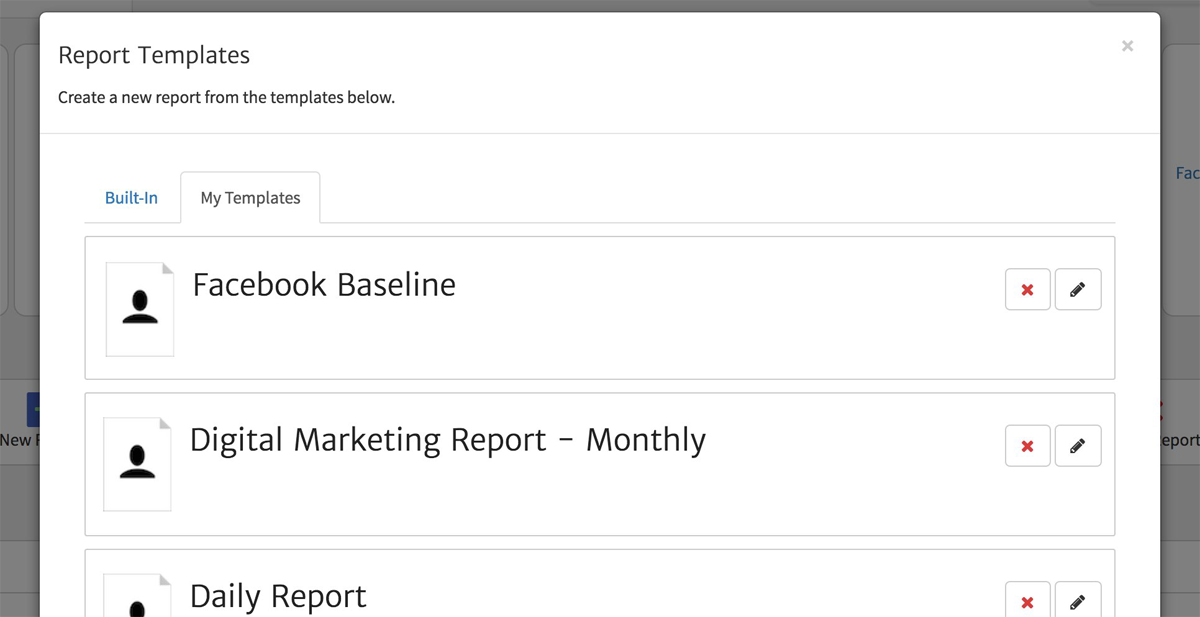
To use your template when created a client report, start by clicking on "New Report", and then select the "My Templates" tab. A selection of your custom-built templates appears and you can pick the most suitable one for your client. The one we just created is shown here as “Facebook Baseline”.
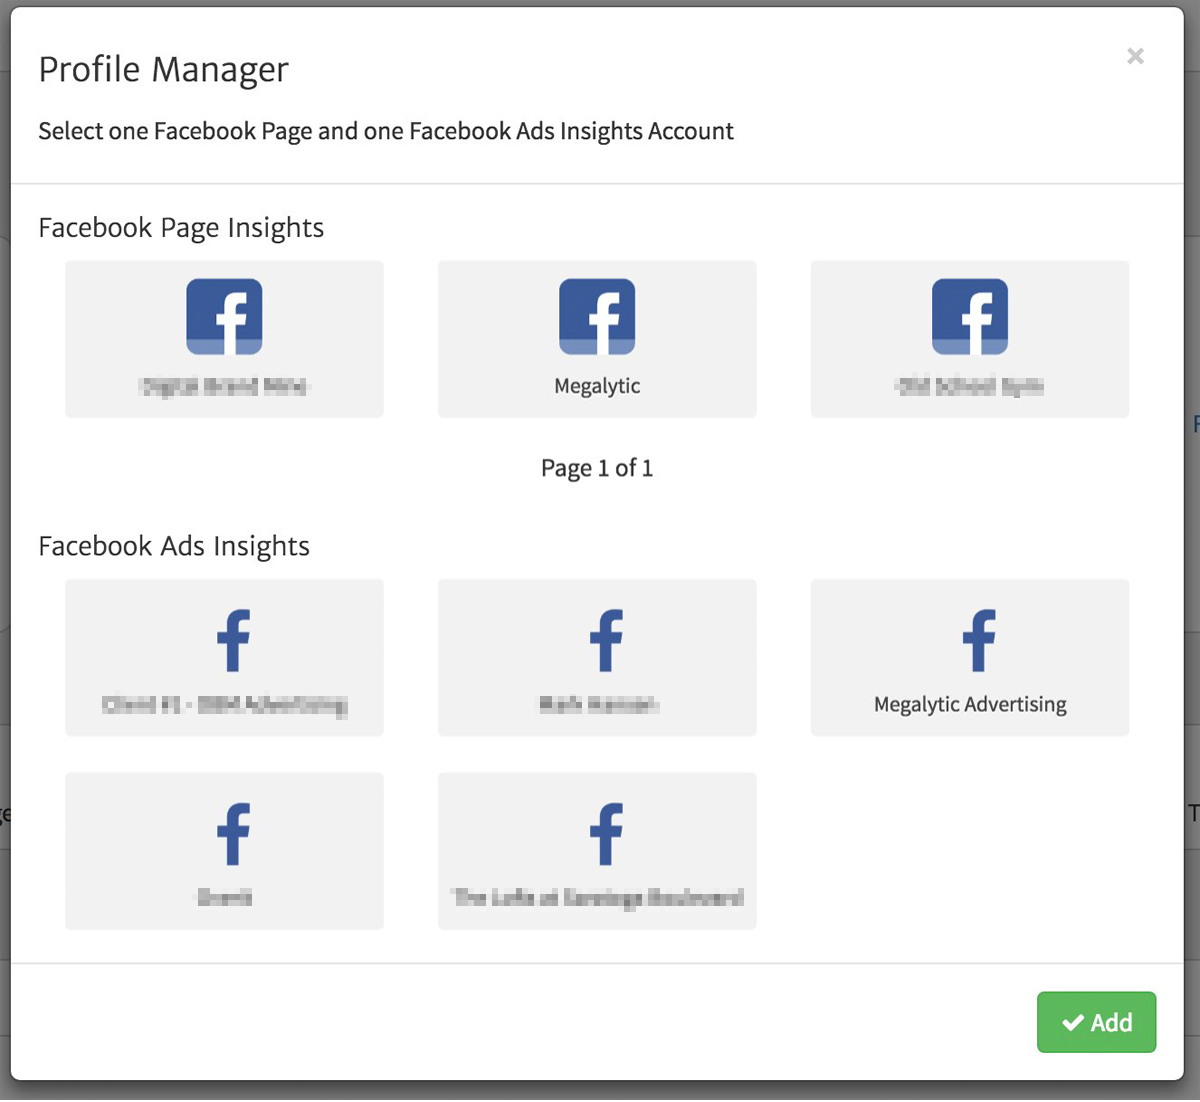
Once you have picked the "Facebook Baseline" template that you created, you will be prompted to connect with a Facebook Ads account and a Facebook Page. Each of those connections is required to create a report from this template because the template was created to show data about both Ads and Pages.
After the report is generated from the template, you can tweak it for your particular needs. You can modify the date ranges, add or delete some widgets, etc. The template is meant to be a starting point that jump-starts your reporting process.
Conclusion
Templates are designed to make agency reporting much easier. Instead of creating a new report for each client, you can reuse a template that contains 90% of what you need across all clients. This makes it much easier to onboard new clients, and to manage a large number of ongoing clients with limited staff.
If you would like to try this out in Megalytic, we offer a 14-day free trial . But even if you don't use Megalytic, the example report shown here provides a blueprint for creating Facebook reports for your clients.